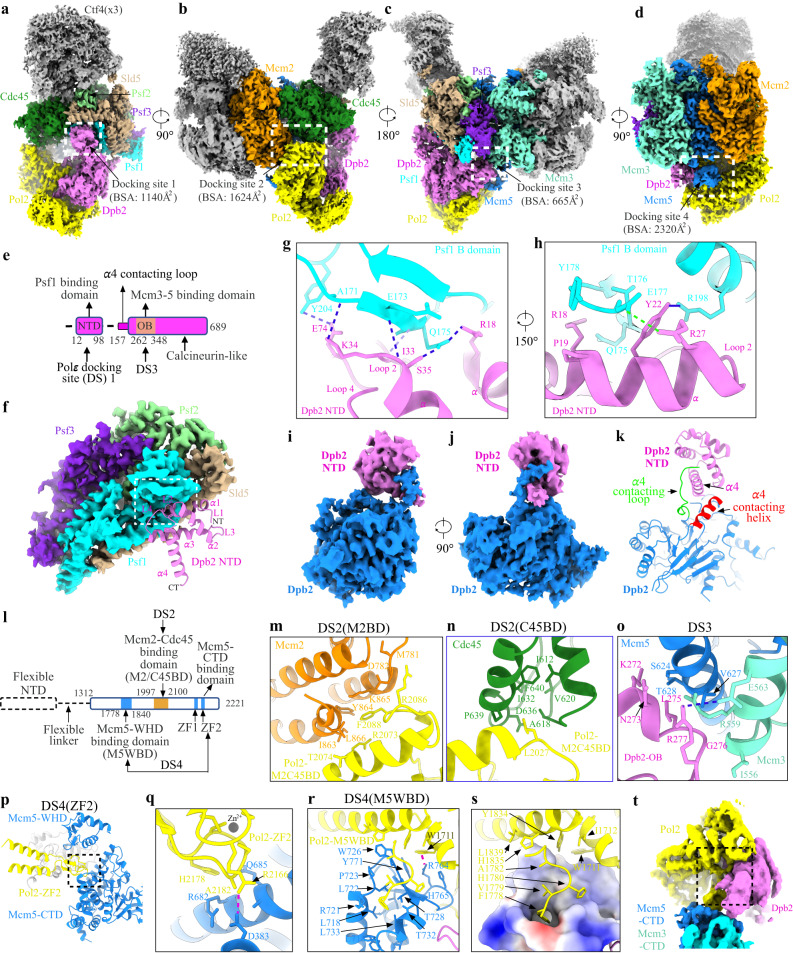
Fig. 1. Detailed interactions of Polε with CMG helicase.
a–d Side views of the cryo-EM density map of the replisome, showing the docking sites of Polε on CMG (dashed squares). For clarity, Mcm6/4/7 subunits and Tof1-Csm3 are removed in (d), highlighting the interaction of Polε with Mcm5. Relevant subunits are color-coded and labeled as indicated. Measured buried surface areas for each interface in (a–d) are labeled. BSA: buried surface area. e Schematic domain organization of Dpb2. f Interaction between Dpb2 and Psf1 with Dpb2-NTD shown in cartoon presentation and GINS displayed with its cryo-EM density map. The α helices and connecting loops of Dpb2-NTD are labeled as indicated. α: helix, L: loop; NT: N-terminus; CT: C-terminus. g, h Magnified views of the boxed region in (f), showing the detailed interaction between Dpb2-NTD and Psf1 B domain in cartoon presentation. The hydrogen bonds are indicated by dashed lines in blue; Salt bridge between E177 of Psf1 and R27 of Dpb2 is indicated by the dashed line in green. i, j Density map of Dpb2 showing the interaction between the NTD and PDE domain of Dpb2. k Atomic model of Dpb2 with α4 contacting loop and helix highlighted in green and red, respectively. l Schematic domain organization of Pol2. Dashed lines denote highly disordered segments that are not resolved in the replisome structure. m Magnified view of the boxed region in (b) highlighting the interaction details of Pol2 with the AAA+ domain of Mcm2 in cartoon presentation. n Magnified view of the boxed region in (b) illustrating the interaction of Pol2 with Cdc45. o Magnified view of the boxed region in (c) showing the Dpb2 OB domain contacting the CTD interface of Mcm3:5. Hydrogen bond between R277 of Dpb2 and E563 of Mcm3 is indicated by the blue dashed line. p Interaction between Pol2-ZF2 (yellow) and Mcm5-CTD (blue). q Magnified view of the boxed region in (p). The hydrogen bond between R2166 of Pol2 and D383 of Mcm5 is indicated by the red dashed line. Zn2+ atom is shown as a gray sphere. r Pol2 (yellow) docking to Mcm5-WHD (blue). Cation-π interaction between R764 of Mcm5 and W1711 of Pol2 is indicated by the dashed line in red. s Same as (r) but shown with the electrostatic surface potential map of Mcm5-WHD, highlighting Mcm5-WHD binding to a region of Pol2 rich in hydrophobic residues. Positively charged residues are in blue; negatively charged residues in red; nonpolar and hydrophobic residues in white. t A replisome conformer exhibiting a highly flexible Mcm5-WHD.

