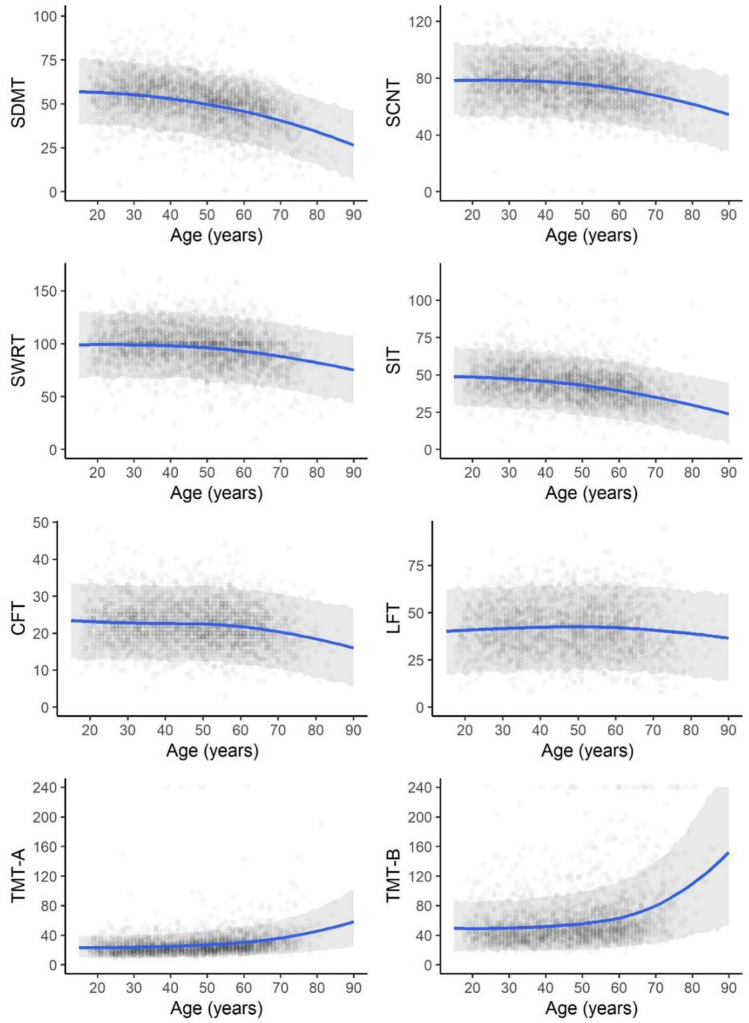
Fig. 2.
Posterior predictive plot depicting the relationship between age and performance in cognitive tests: blue lines represent the expected cognitive performance in raw values for different years of age under the constraint of assuming 14 years of formal education while refraining from specifying gender and language used during the examination; grey bands represent 95% posterior predictive intervals, and dots represent observed values

