Fig. 1.
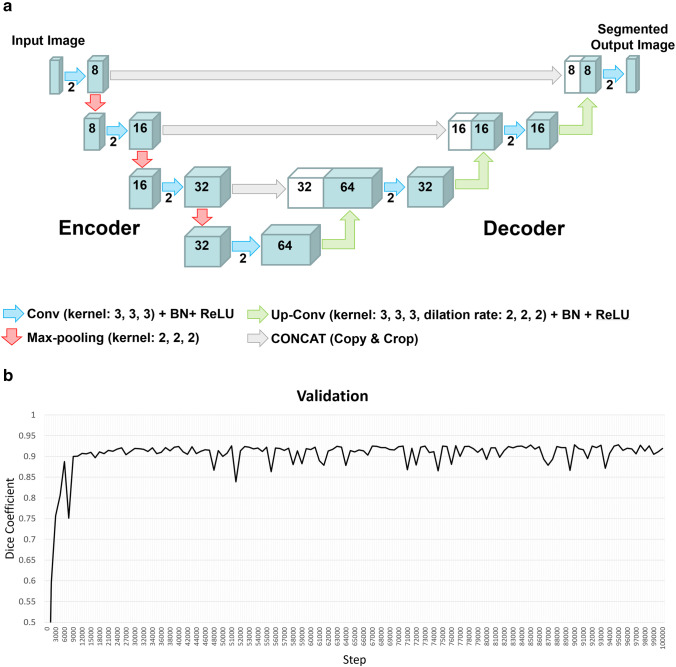
3D U-Net model with four layers and validation result for Brain Subregion Analysis application. a Each blue box corresponds to a multi-channel feature map. The number of channels is denoted on top of the box. White boxes indicate copied feature maps. The color arrows indicate each process: sky blue arrows indicate convolution (Conv) with kernel size (3, 3, 3) in addition to batch normalization (BN) and rectified linear unit (ReLU) activation layer, red arrows indicate max-pooling with kernel size (2, 2, 2), green arrows indicate up-convolution (Up-Conv) with kernel size (3, 3, 3) and dilation rate (2, 2, 2) in addition to BN and ReLU, and gray arrows indicate direct concatenation from each encoding layer of feature map extracted by downsampling to the corresponding decoding layer of feature map by upsampling. b Dice coefficients for each validation step of the 3D U-Net model. The dice coefficient exceeded 0.9 at 10,000 steps and remained consistently high until 100,000 steps

