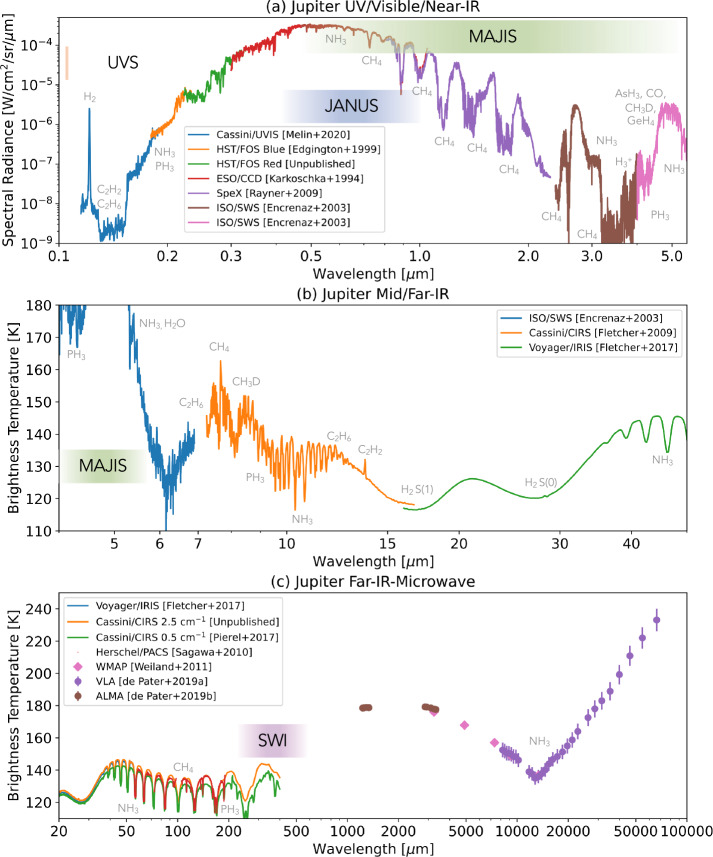
Fig. 3.
Overview of Jupiter’s reflected ( μm) and thermal emission ( μm) spectra, with key molecular features labelled, and the approximate ranges covered by UVS, JANUS, MAJIS and SWI. UV, visible, and near-IR spectra in (a) were created from a low-latitude spectrum from Cassini/UVIS (Melin et al. 2020); Hubble FOS spectra at N acquired in November 1992 with the blue and red detectors (Edgington et al. 1999); disc-averaged measurements from the European Southern Observatory (Karkoschka 1994) converted from albedo to spectral radiance assuming the solar spectrum of (Meftah et al. 2018); disc-averaged measurements from IRTF SpeX instrument (Rayner et al. 2009) approximately scaled to match adjacent datasets; and disc-averaged ISO/SWS measurements from Encrenaz (2003). Mid- and far-IR spectra in (b) were from ISO/SWS, plus low-latitudes averages from Cassini/CIRS (Fletcher et al. 2009) and Voyager-1/IRIS (Fletcher et al. 2017b). Far-IR to microwave spectra in (c) were from averaged Cassini/CIRS spectra (Pierel et al. 2017), Herschel/PACS observations (Sagawa et al. 2010); and disc-averaged brightnesses from WMAP and ALMA in the millimetre (Weiland et al. 2011; de Pater et al. 2019a) and VLA in the centimetre (de Pater et al. 2019b)

