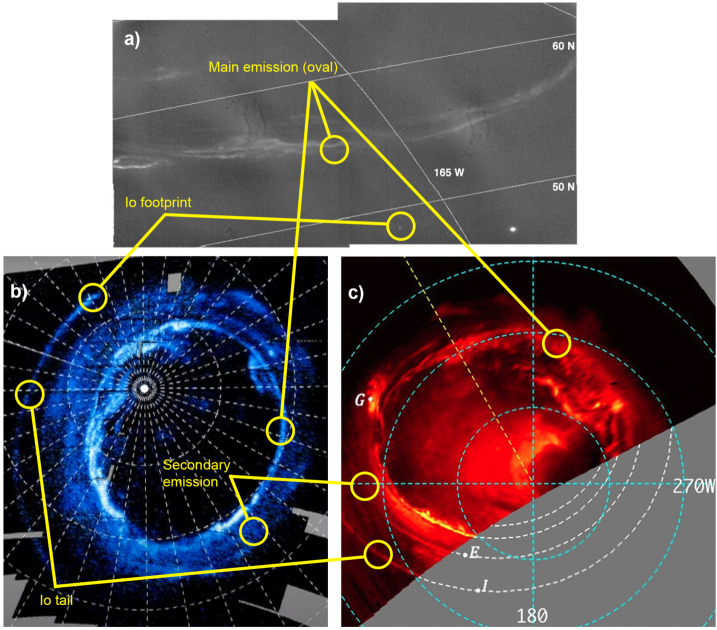
Fig. 8.
Example auroral images obtained from Jovian orbit at three wavelengths, at different epochs and orientations, with some key features labelled. Lines of System-III longitude and latitude are shown on each. See Fig. 2 of Grodent (2015) for a comprehensive overview of features at UV wavelengths. a) Galileo SSI visible light image of the northern aurora, at a spatial resolution ∼26 km/pix, obtained in November 1997; presented in Fig. 1 of Vasavada et al. (1999), and released as NASA PIA01602 (Credit: NASA/JPL-Caltech). b) Polar projection of May 2017 data from Juno UVS, here showing the southern aurora, presented in detail in Fig. 2 of Bonfond et al. (2021) (Credit: NASA/JPL-Caltech/SwRI/UVS/ULiège). c) Juno JIRAM mosaic map of the southern auroral oval, taken during August 2016. White points are predicted footprint positions indicated by letters I, E, and G for the moons Io, Europa, and Ganymede, respectively. Presented in detail by Mura et al. (2017), Fig. 2 (credit: NASA/JPL-Caltech/SwRI/ASI/INAF/JIRAM)

