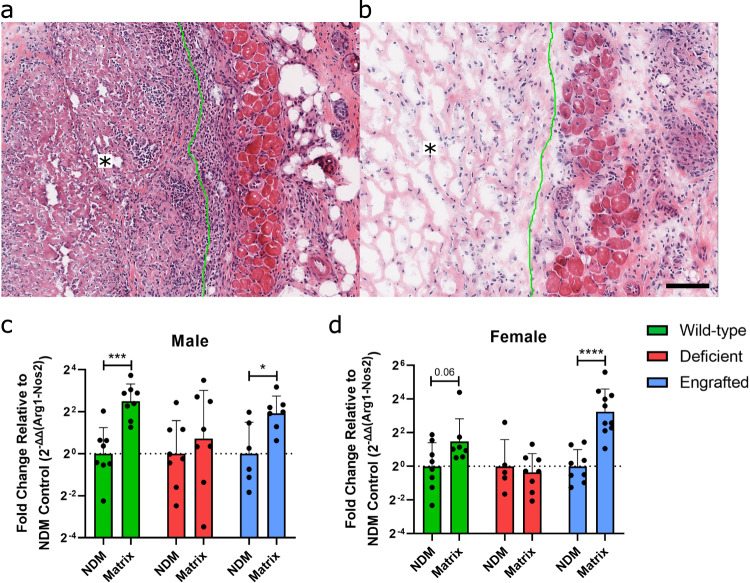
Fig. 3. Comparison of mast cell influence in response to non-decellularized and decellularized ECM scaffolds.
Representative hematoxylin and eosin staining in mast cell-deficient mice following dorsal subcutaneous injection of a non-decellularized and b decellularized ECM scaffold at 7 days post-injection (material outlined in green with an asterisk on side where material is present). Scale bar is 100 µm. Gene expression ratio at day 7 post-injection of M2/M1 macrophage markers Arg1 relative to Nos2 in c male and d female mice. Decellularized ECM scaffold in wild-type (green), mast cell-deficient (red), and mast cell-engrafted (blue) groups were compared by relative gene expression with 2−ΔΔct normalized to non-decellularized (NDM) control per group. n = 6–10 per group. Data displayed as geometric mean ± geometric SD with results pooled from 2–3 independent experiments. (Value displayed for trend p ≤ 0.1, *p < 0.05, ***p < 0.001 and ****p < 0.0001).

