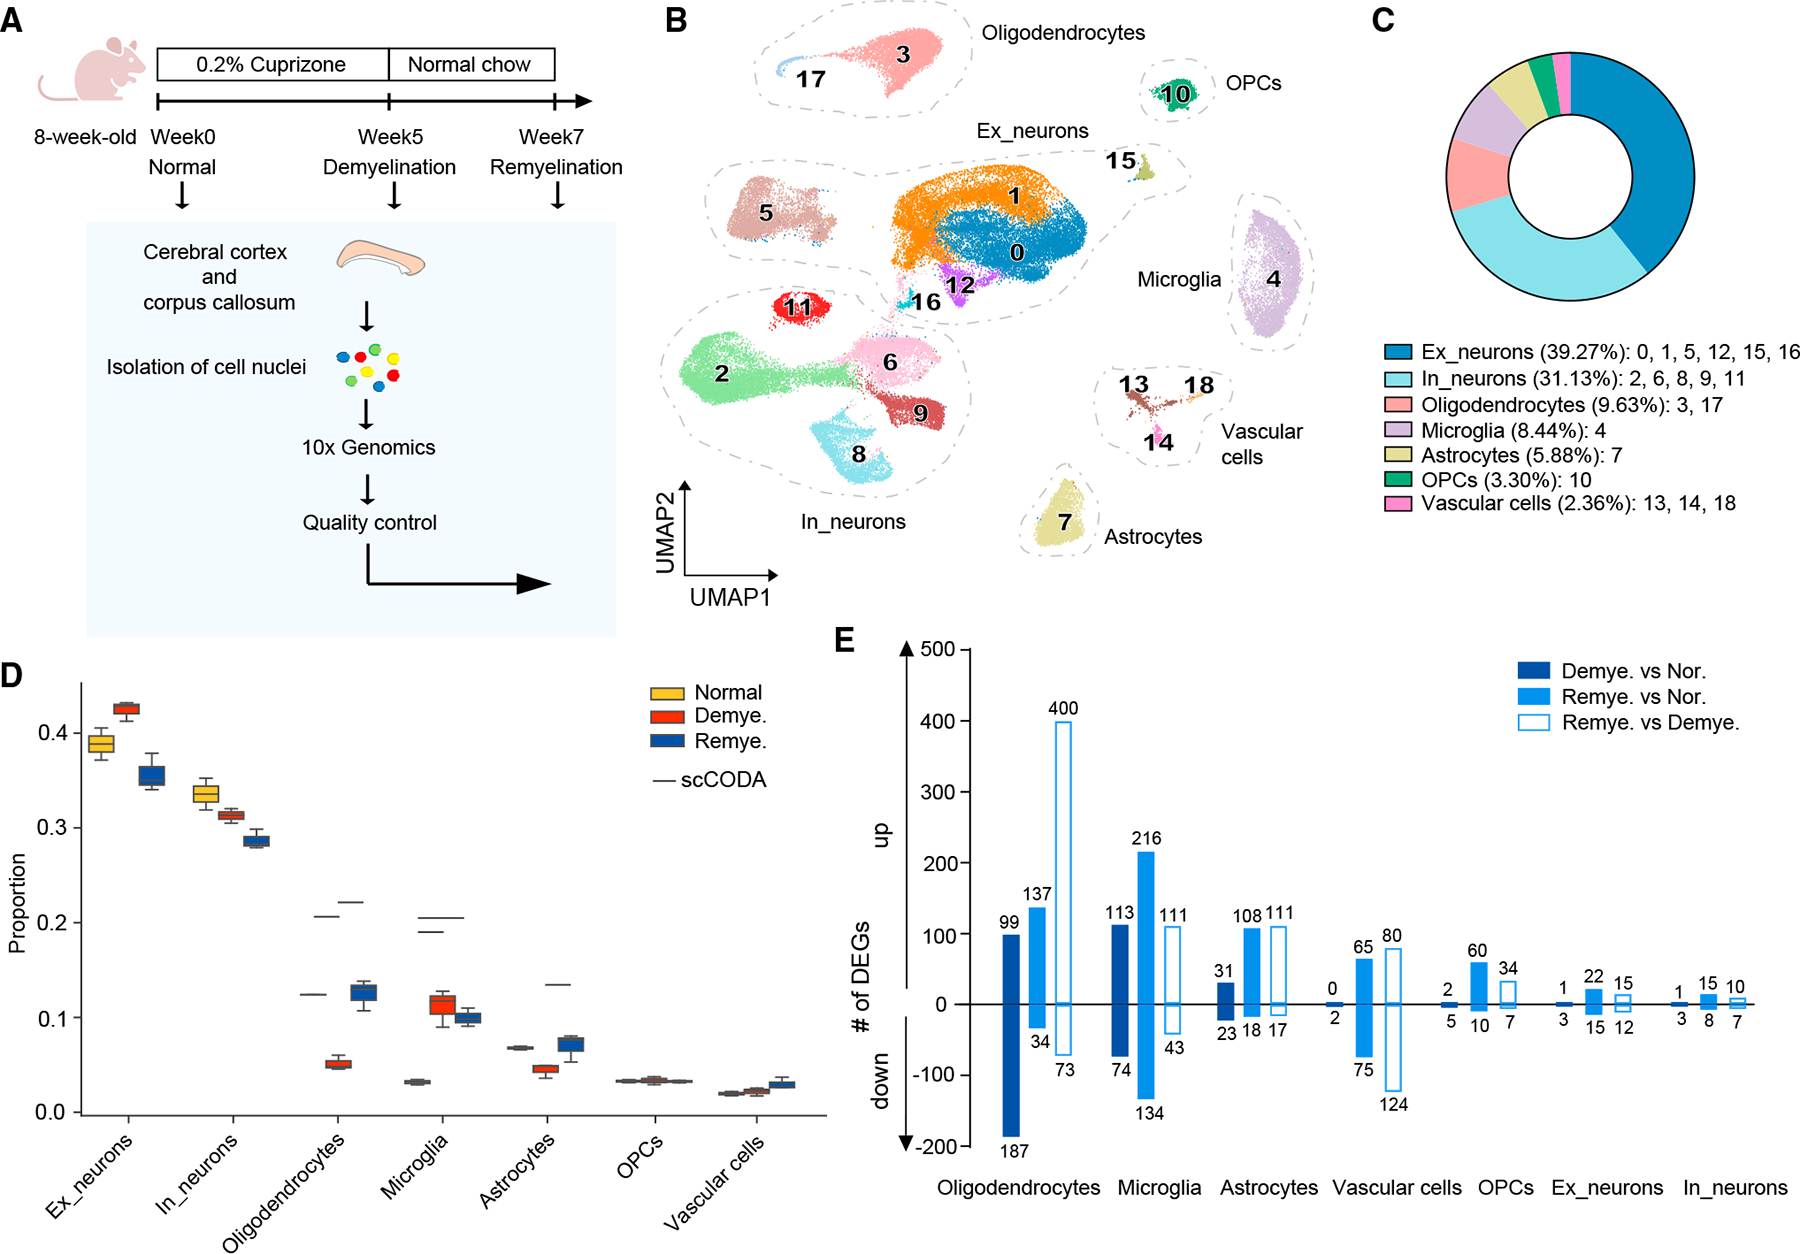
Figure 1. CPZ-mediated myelin alterations induce global transcriptional changes.

(A) Schematic diagram of the experimental strategy.
(B) UMAP plot of 58,079 nuclei showing 19 distinguished clusters with cell-type identities determined by expression of specific markers. n = 2 mice in normal, n = 3 in demyelination, and n = 3 in remyelination condition.
(C) Pie chart showing the frequency of each cell type across all conditions.
(D) Cell-type compositional analysis across different conditions. Statistically credible changes, as tested by scCODA, are denoted with bars on top. n = 2 mice innormal, n = 3 in demyelination, and n = 3 in remyelination condition.
(E) Number of differentially expressed genes (DEGs) in each cell type by pairwise comparisons between demyelination vs. normal (Demye. vs. Nor.), remyelinationvs. normal (Remye. vs. Nor.), or remyelination vs. demyelination (Remye. vs. Demye.). Log2(fold change) > 0.5, adjusted p < 0.05, non-parametric Wilcoxon rank-sum test, Bonferroni correction.
