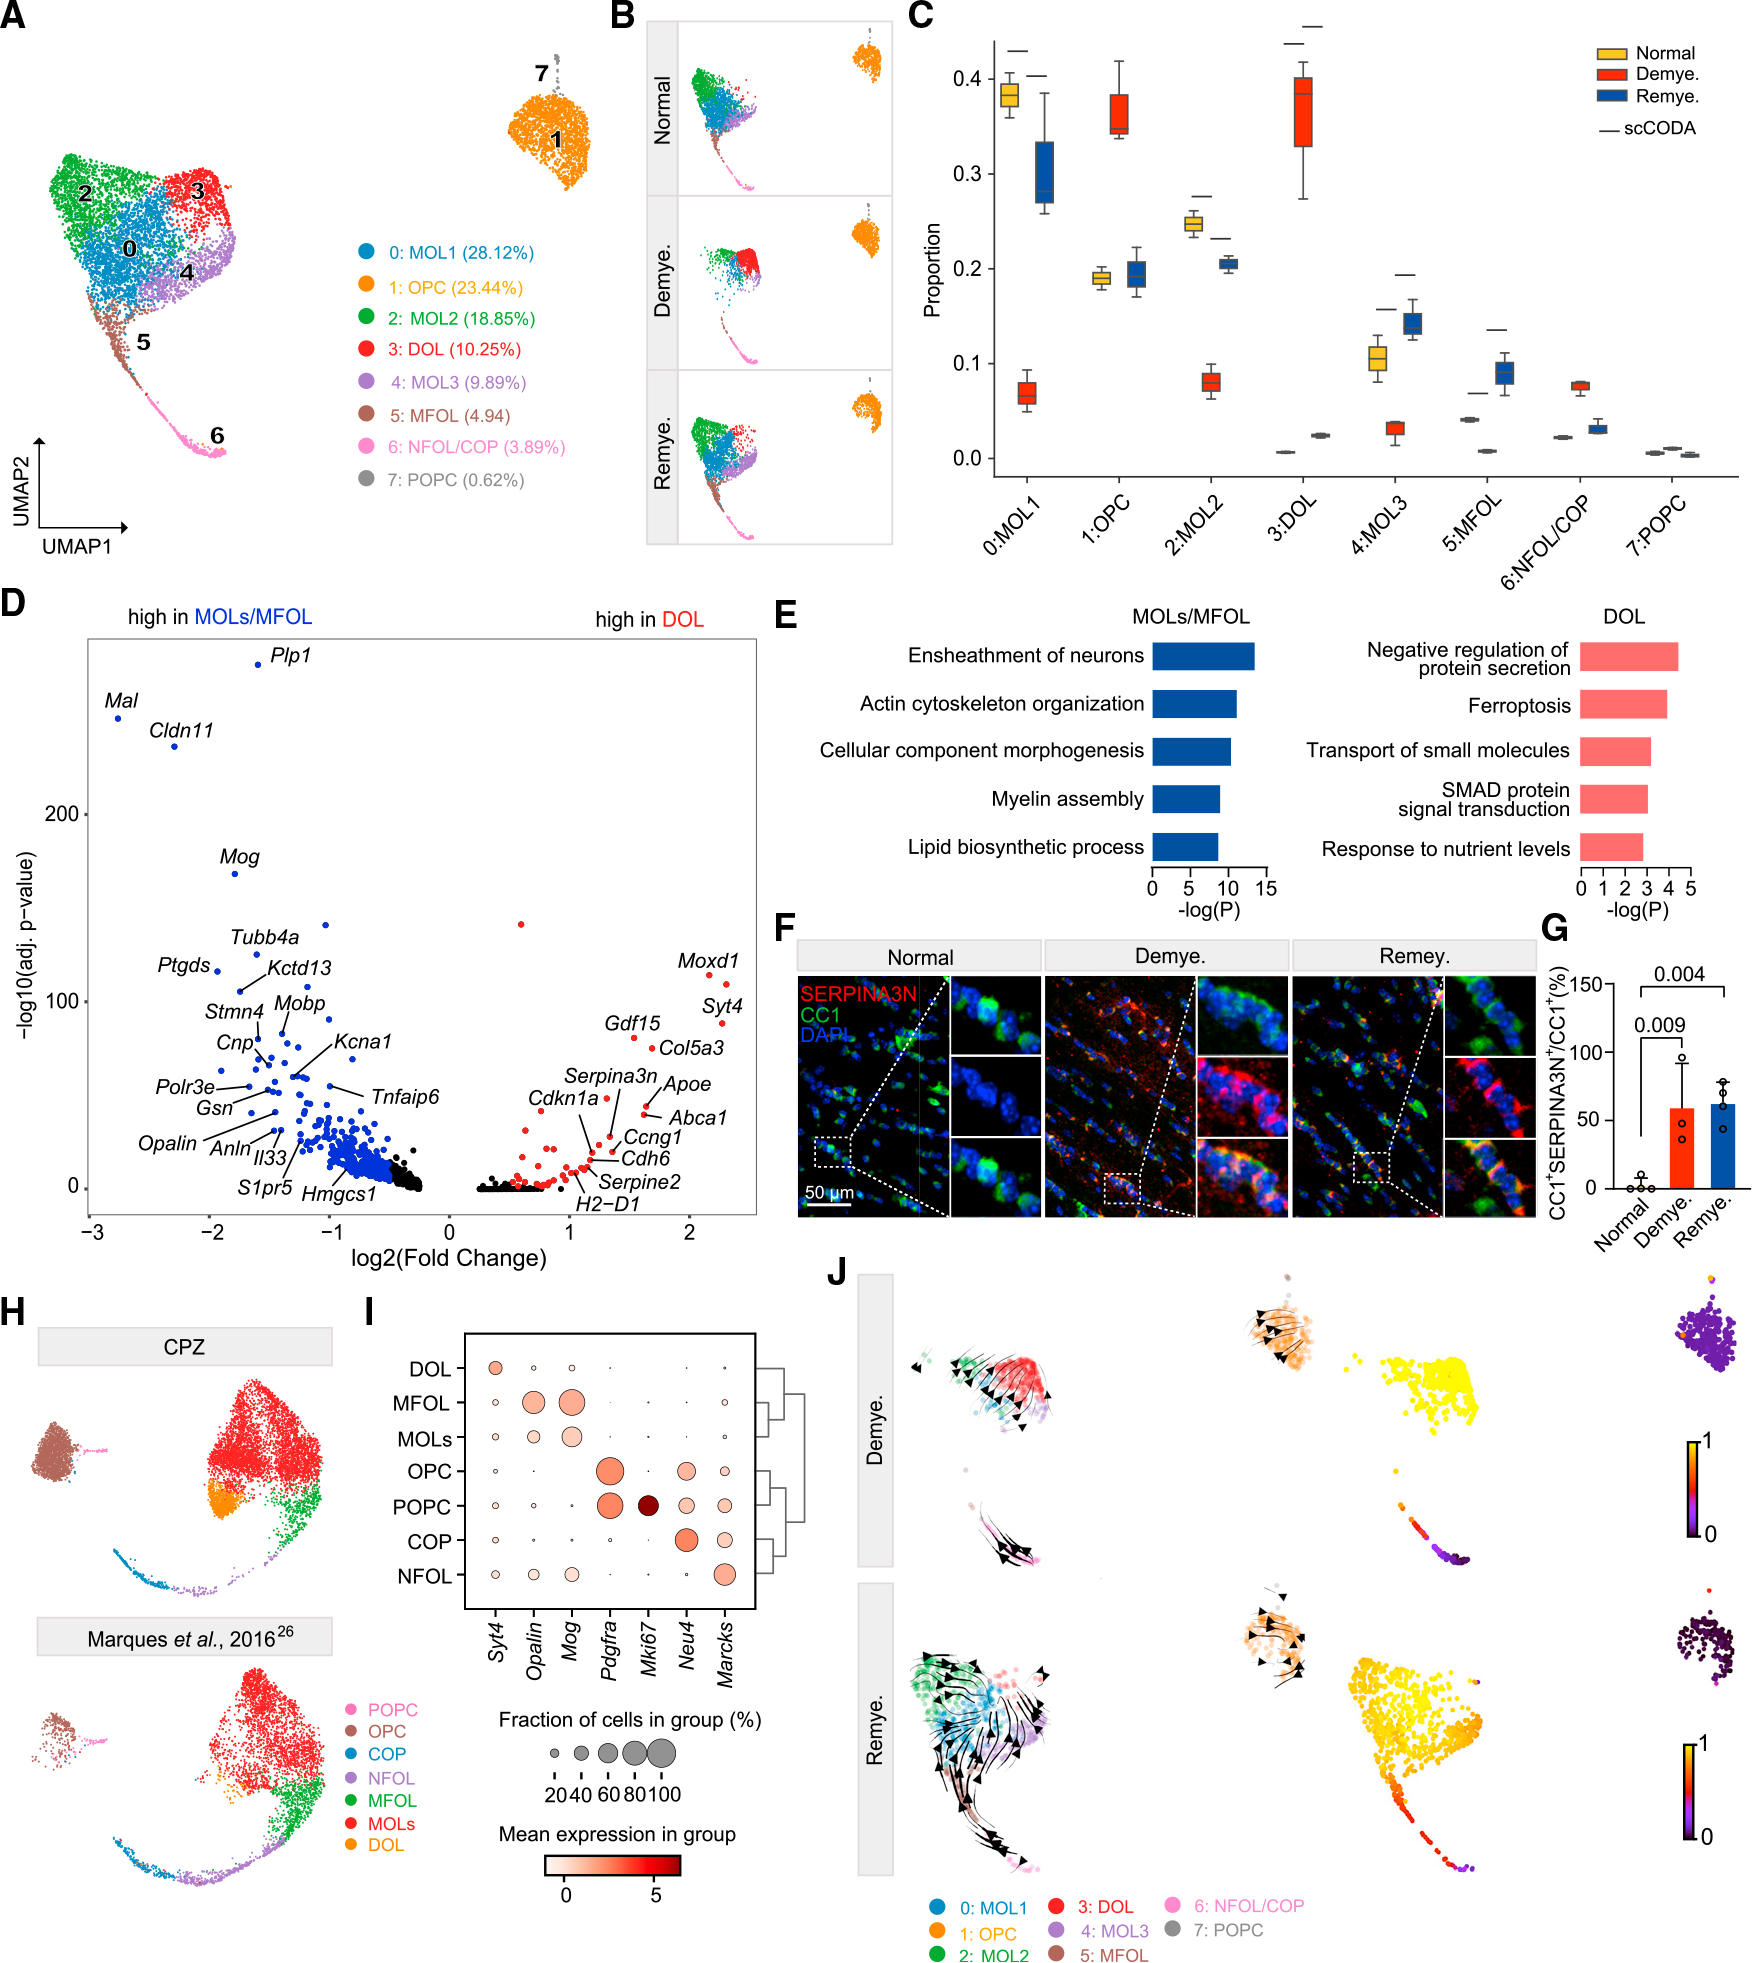
Figure 2. Demyelination induces SERPINA3N+ oligodendrocytes.

(A) UMAP plot of reclustered oligodendrocyte lineage nuclei identifying eight subclusters. n = 7,251 oligodendrocyte lineage nuclei.
(B) UMAP plot of oligodendrocyte subclusters split by condition. n = 2,572 nuclei in normal, n = 1,839 nuclei in demyelination, and n = 2,840 nuclei in remyelination.
(C) Subcluster compositional analysis across different conditions. Statistically credible changes, as tested by scCODA, are denoted with bars on top. n = 2 mice in normal, n = 3 in demyelination, and n = 3 in remyelination condition.
(D) Volcano plot showing significant DEGs in DOLs (subcluster 3) vs. MOLs/MFOLs (subclusters 0, 2, 4, 5). Log2(fold change) > 0.5, adjusted p < 0.05, non-parametric Wilcoxon rank-sum test, Bonferroni correction.
(E) Pathways enriched in MOLs/MFOLs (left panel) and DOLs (right panel). p value by hypergeometric test.
(F) Representative immunofluorescence (IF) images of SERPINA3N and CC1 staining in the medial corpus callosum (MCC) in each condition. CC1, green;SERPINA3N, red; DAPI, blue. Scale bar, 50 μm.
(G) Quantification of SERPINA3N+CC1+/CC1+ ratio across different conditions. p value by one-way ANOVA with Tukey’s multiple comparisons test. Data are presented as mean ± SD. n = 3 mice/condition.
(H) Integration of oligodendrocyte lineage cells from Marques et al.26 and the current CPZ dataset. UMAP plot split by datasets.
(I) Dot plot of marker genes enriched in each subpopulation of the integrated data in (H).
(J) UMAP plot of oligodendrocyte lineage cells overlaid with the RNA velocity streamlines derived from the basic model, colored by annotated subcluster (left).
Corresponding velocity pseudo-time shown on the right. One sample per condition is shown.
See also Figures S2 and S3; Table S2.
