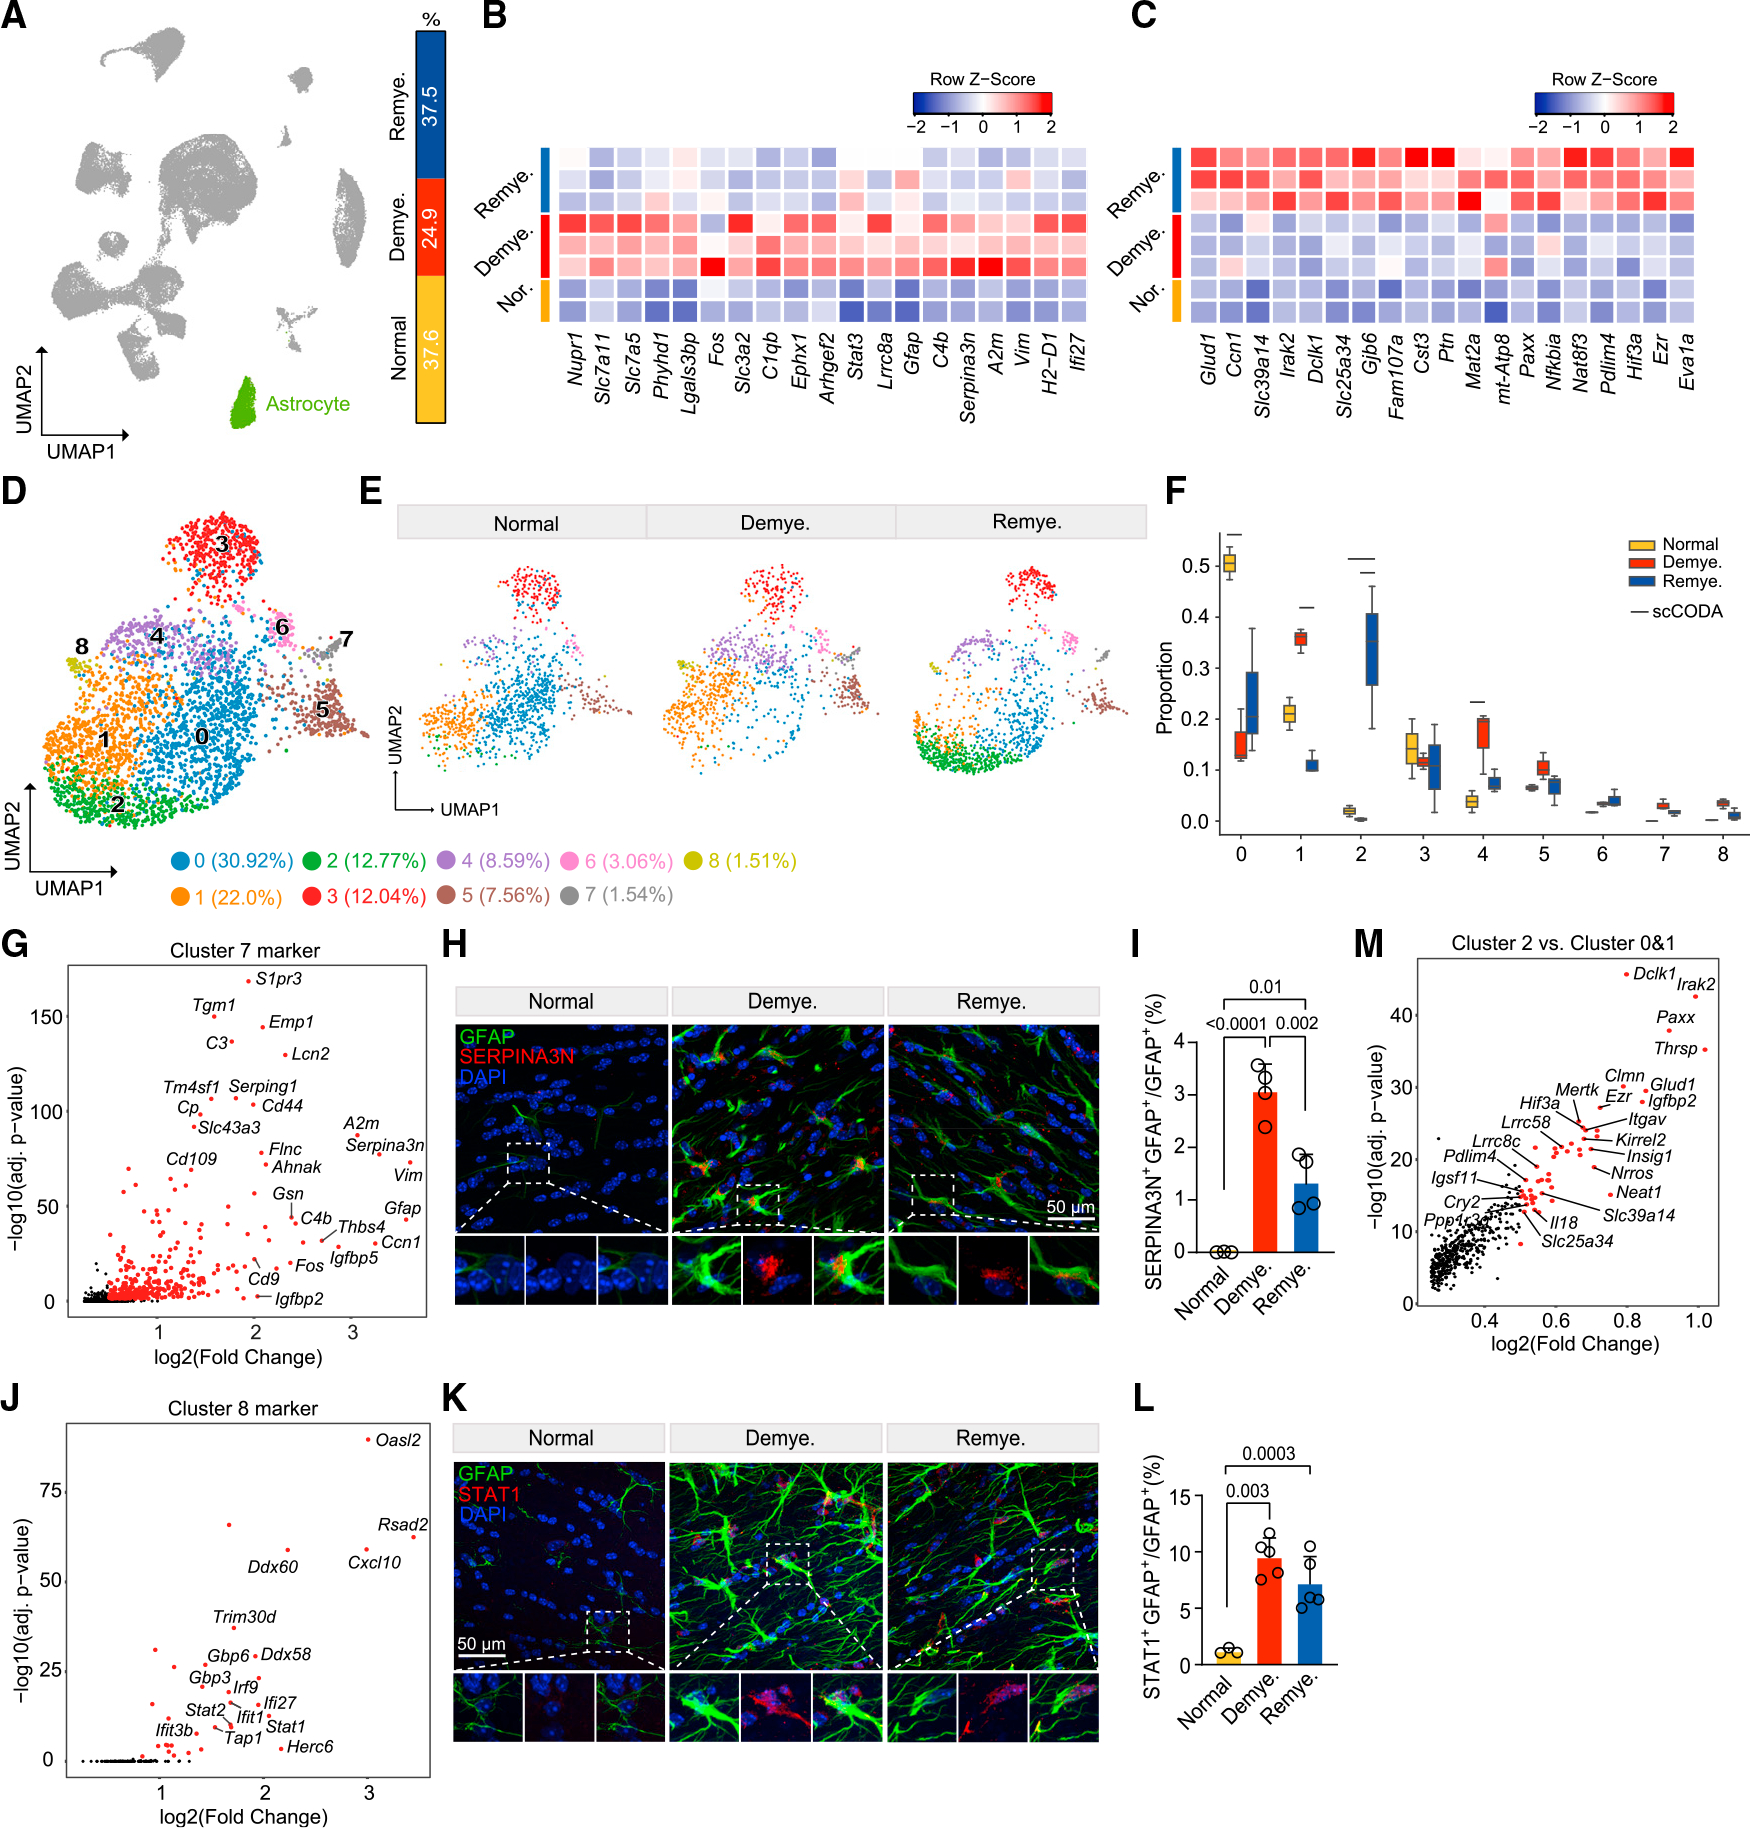
Figure 3. Astrocytes adopt distinct stress-response signatures in demyelination and remyelination.

(A) UMAP plot showing the astrocyte cluster (cluster 7 in Figure 1B), and relative frequency across different conditions.
(B and C) Heatmap showing average expression of top astrocyte DEGs upregulated in demyelination vs. normal (B) and in remyelination vs. demyelination (C). Log2(fold change) > 0.5, adjusted p < 0.05, non-parametric Wilcoxon rank-sum test, Bonferroni correction. Each column represents one sample. Color scheme represents row Z score.
(D) UMAP plot of reclustered astrocytes identifying nine subclusters. n = 3,305 astrocyte nuclei.
(E) UMAP plot of astrocyte subclusters split by condition. n = 1,114 astrocyte nuclei in normal, n = 986 in demyelination, and n = 1,205 in remyelination.
(F) Subcluster compositional analysis across different conditions. Statistically credible changes, as tested by scCODA, are denoted with bars on top. n = 2 mice in normal, n = 3 in demyelination, and n = 3 in remyelination condition.
(G) Volcano plot showing subcluster 7 marker genes.
(H) Representative IF images showing colocalization of SERPINA3N and GFAP in lateral CC in each condition. SERPINA3N, red; GFAP, green; DAPI, blue. Scalebar, 50 μm.
(I) Quantification of SERPINA3N+GFAP+/GFAP+ ratio across different conditions. Data are presented as mean ± SD. n = 3–4 mice/condition.
(J) Volcano plot showing subcluster 8 marker genes.
(K) Representative IF images showing colocalization of STAT1 and GFAP in LCC in each condition. STAT1, red; GFAP, green; DAPI, blue. Scale bar, 50 μm.
(L) Quantification of STAT1+GFAP+/GFAP+ ratio across different conditions. Data are presented as mean ± SD. n = 3–5 mice/condition.
(M) Volcano plot showing DEGs of subcluster 2 vs. subclusters 0 and 1.
Adjusted p values by non-parametric Wilcoxon rank-sum test, Bonferroni correction (G, J, and M). p values by one-way ANOVA with Tukey’s multiple comparisons test (I and L). See also Figure S4 and Table S2.
