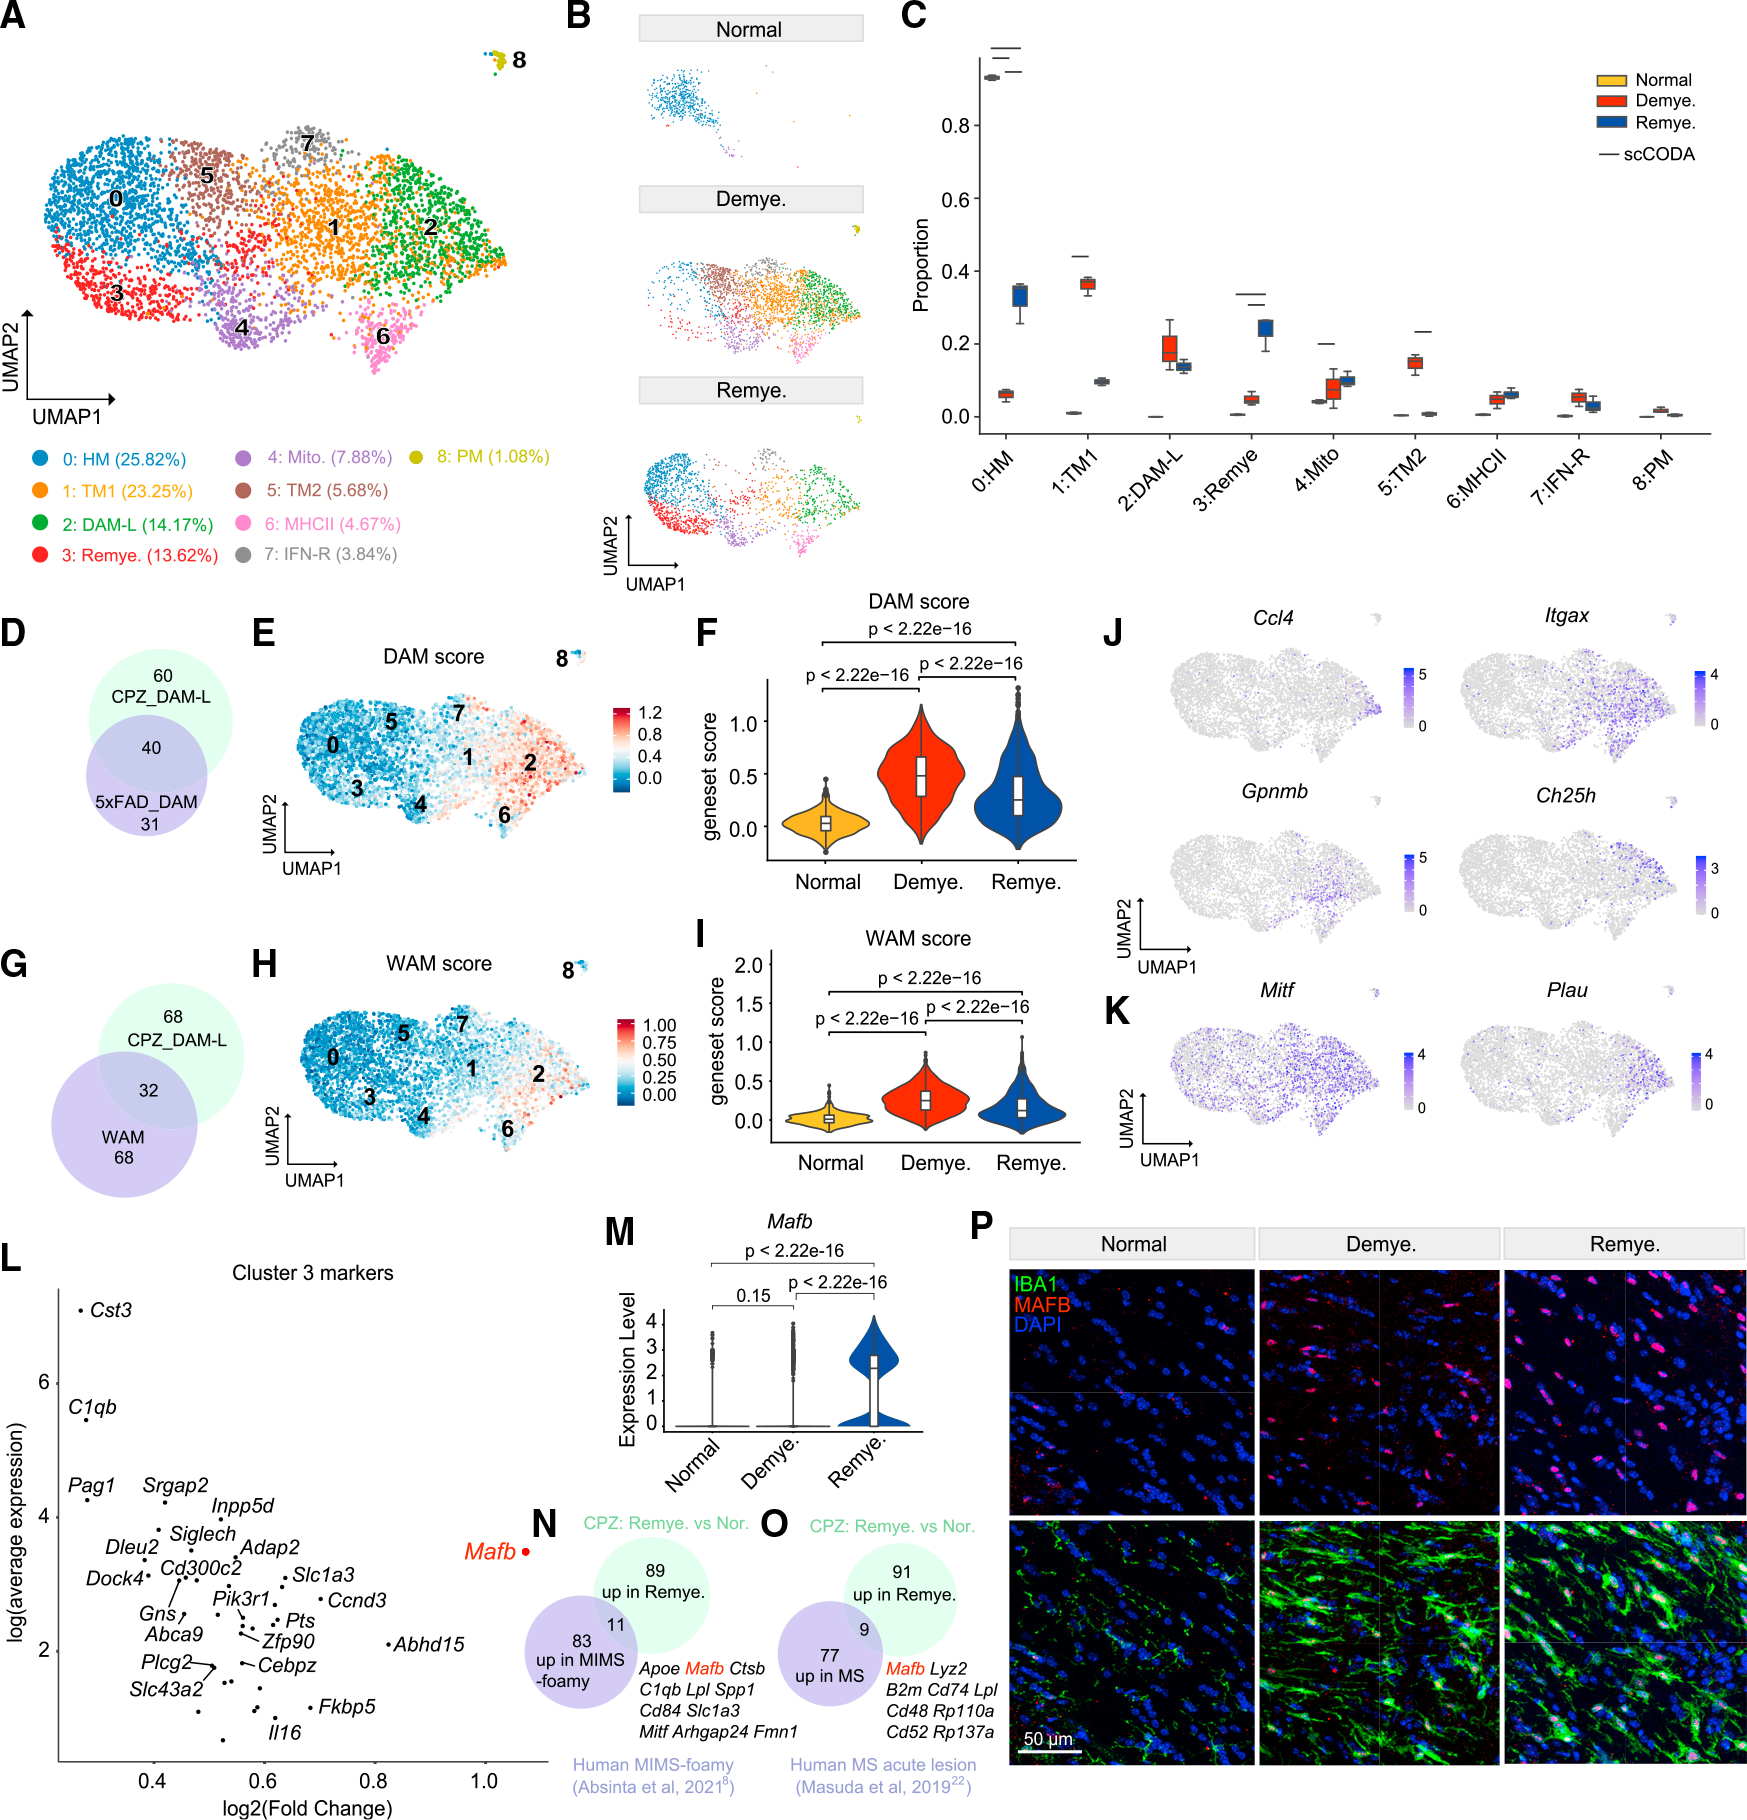
Figure 4. MAFBhi microglia emerge in remyelination.

(A) UMAP plot of reclustered microglia identifying nine subclusters. n = 4,736 microglial nuclei.
(B) UMAP plot of microglia subclusters split by condition. n = 510 nuclei in normal, n = 2,450 nuclei in demyelination, and n = 1,776 nuclei in remyelination.
(C) Subcluster compositional analysis across different conditions. Statistically credible changes, as tested by scCODA, are denoted with bars on top. n = 2 mice in normal, n = 3 in demyelination, and n = 3 in remyelination condition.
(D) Venn diagram depicting overlap between the top 100 markers of microglia subcluster 2 (DAM-L) and the top 71 signature genes of DAM identified in the 5XFADmodel.55 Gene sets used are listed in Table S3.
(E) UMAP plot showing the DAM signature score calculated using the top 71 signature genes of DAM.
(F) Violin plot showing DAM gene set score in each condition. p value by Wilcoxon test.
(G) Venn diagram depicting overlap between the top 100 markers of microglia subcluster 2 (DAM-L) and the top 100 signature genes of white matter associatedmicroglia (WAM) from Safaiyan et al.56 Gene sets used are listed in Table S3.
(H) UMAP plot showing the WAM score calculated using the top 100 signature genes of WAM.
(I) Violin plot showing WAM gene set score in each condition. p value by Wilcoxon test.
(J) UMAP plots showing expression pattern of Ccl4, Itgax, Gpnmb, and Ch25h in microglia subclusters.
(K) UMAP plots showing expression pattern of Mitf and Plau in microglia subclusters.
(L) Scatter plot showing subcluster 3 marker genes. Adjusted p value by non-parametric Wilcoxon rank-sum test, Bonferroni correction.
(M) Violin plot of microglial expression of Mafb in each condition. p value by Wilcoxon test.
(N) Venn diagram of overlap between top 94 markers of “microglia inflamed in multiple sclerosis”-foamy (MIMS-foamy) from Absinta et al.8 and top 100 genes upregulated in microglia in remyelination vs. normal in the mouse CPZ model. Overlapping genes are listed on the side. Gene sets used are listed in Table S3.
(O) Venn diagram of overlap between top 86 genes upregulated in microglia from patients with early active MS from Masuda et al.22 and top 100 genes upregulated in microglia in remyelination vs. normal in the mouse CPZ model. Overlapping genes are listed on the side. Gene sets used are listed in Table S3.
(P) Representative IF images showing staining of MAFB and IBA1 in the MCC in each condition. IBA1, green; MAFB, red; DAPI, blue. Scale bar, 50 μm.
