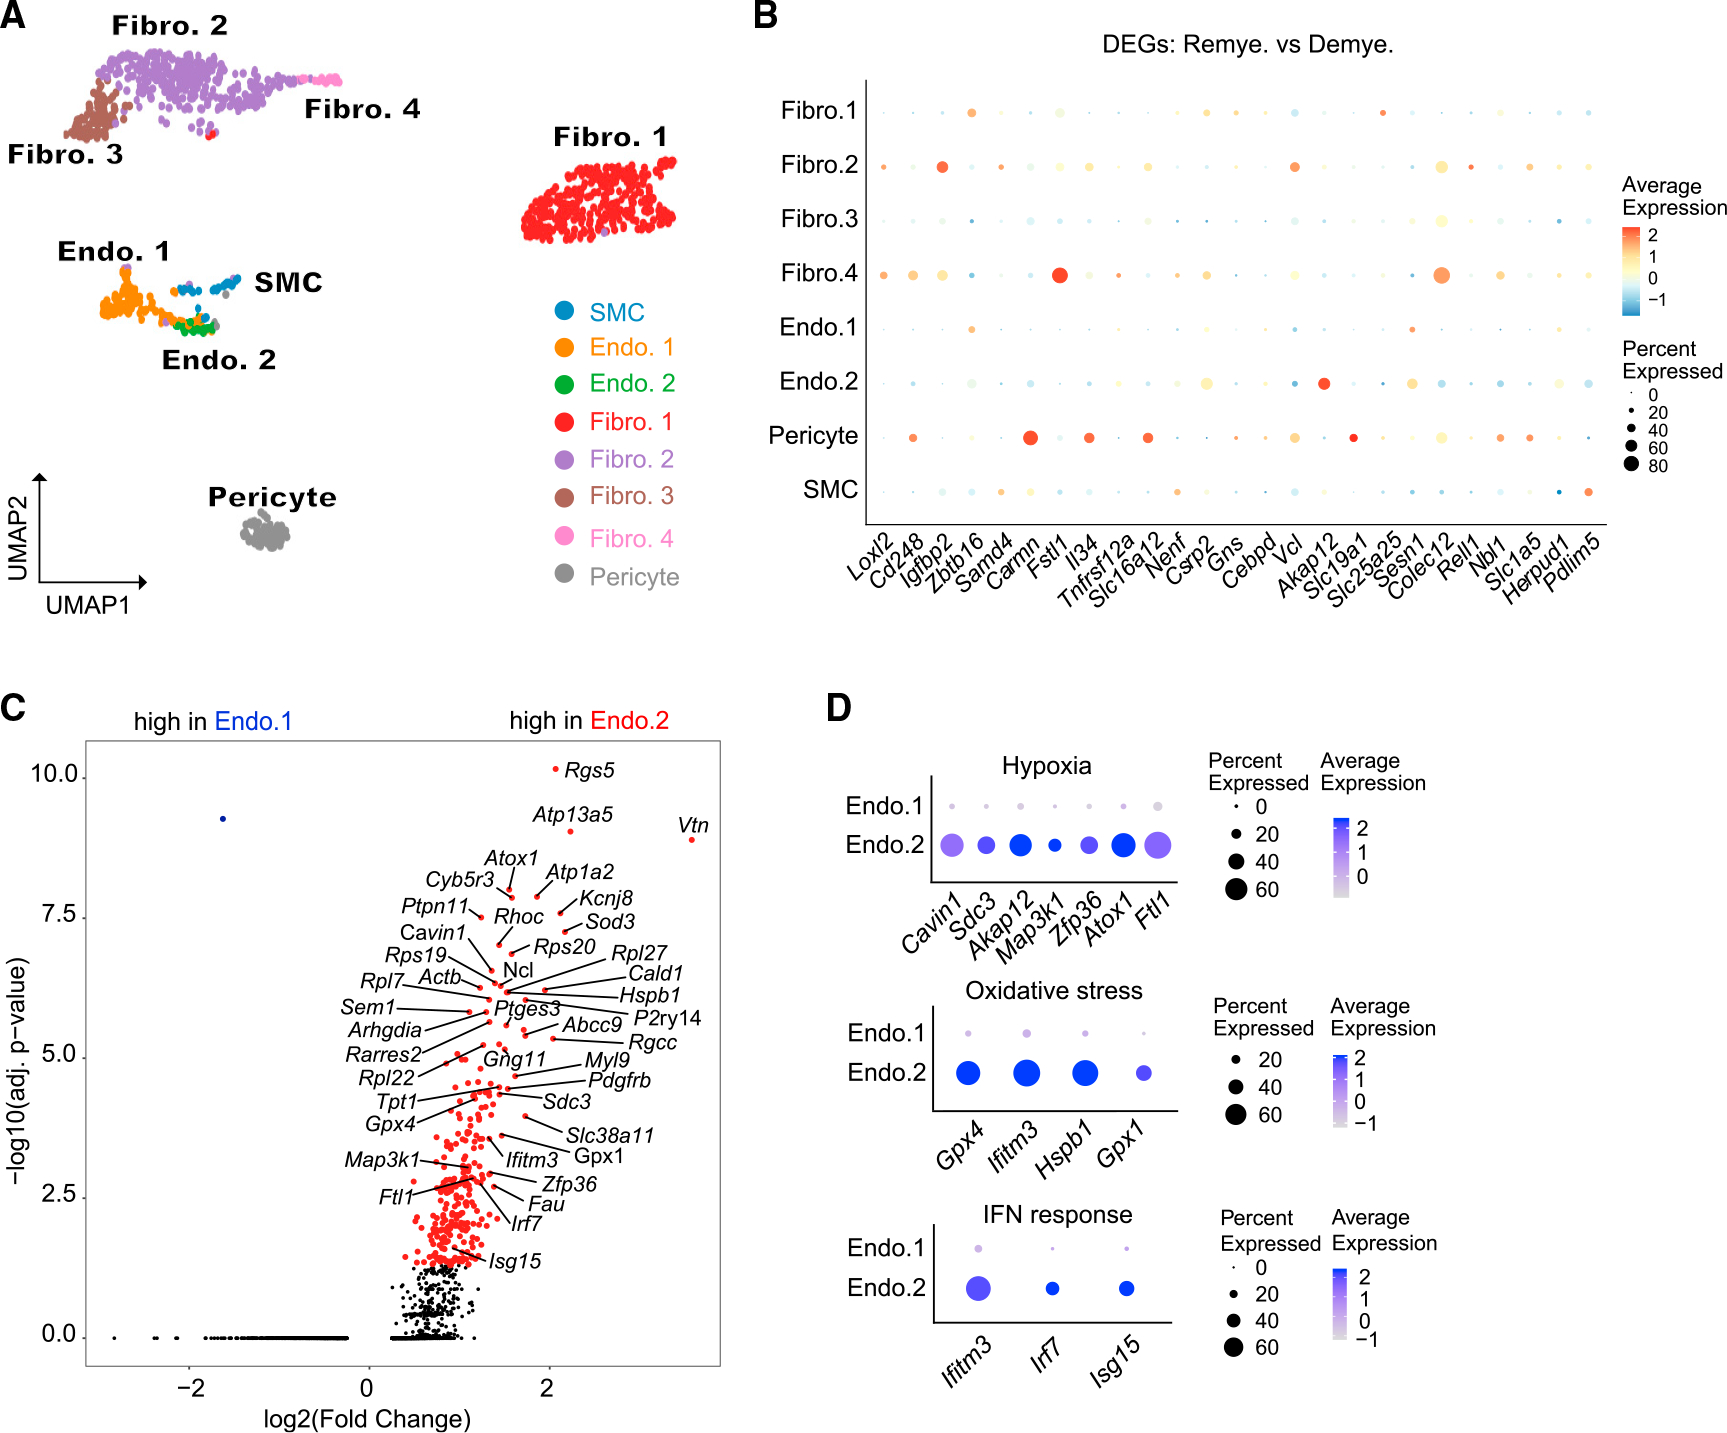
Figure 5. Remyelination is associated with reprogramming of vascular cells.

(A) UMAP plot of reclustered vascular cells identifying fibroblasts (Fibro.1–4), endothelial cells (Endo.1 and Endo.2), smooth muscle cells (SMC), and pericytes. n = 1,062 vascular nuclei. n = 2 mice in normal, n = 3 in demyelination, and n = 3 in remyelination condition.
(B) Dot plot showing expression of top DEGs between remyelination and demyelination in each subcluster.
(C) Volcano plot showing significant DEGs between Endo.2 and Endo.1. Log2(fold change) > 0.5, adjusted p < 0.05, non-parametric Wilcoxon rank-sum test, Bonferroni correction.
(D) Dot plot showing expression of DEGs (from C) involved in hypoxia, oxidative stress, and IFN-response pathways across Endo.1 and Endo.2.
