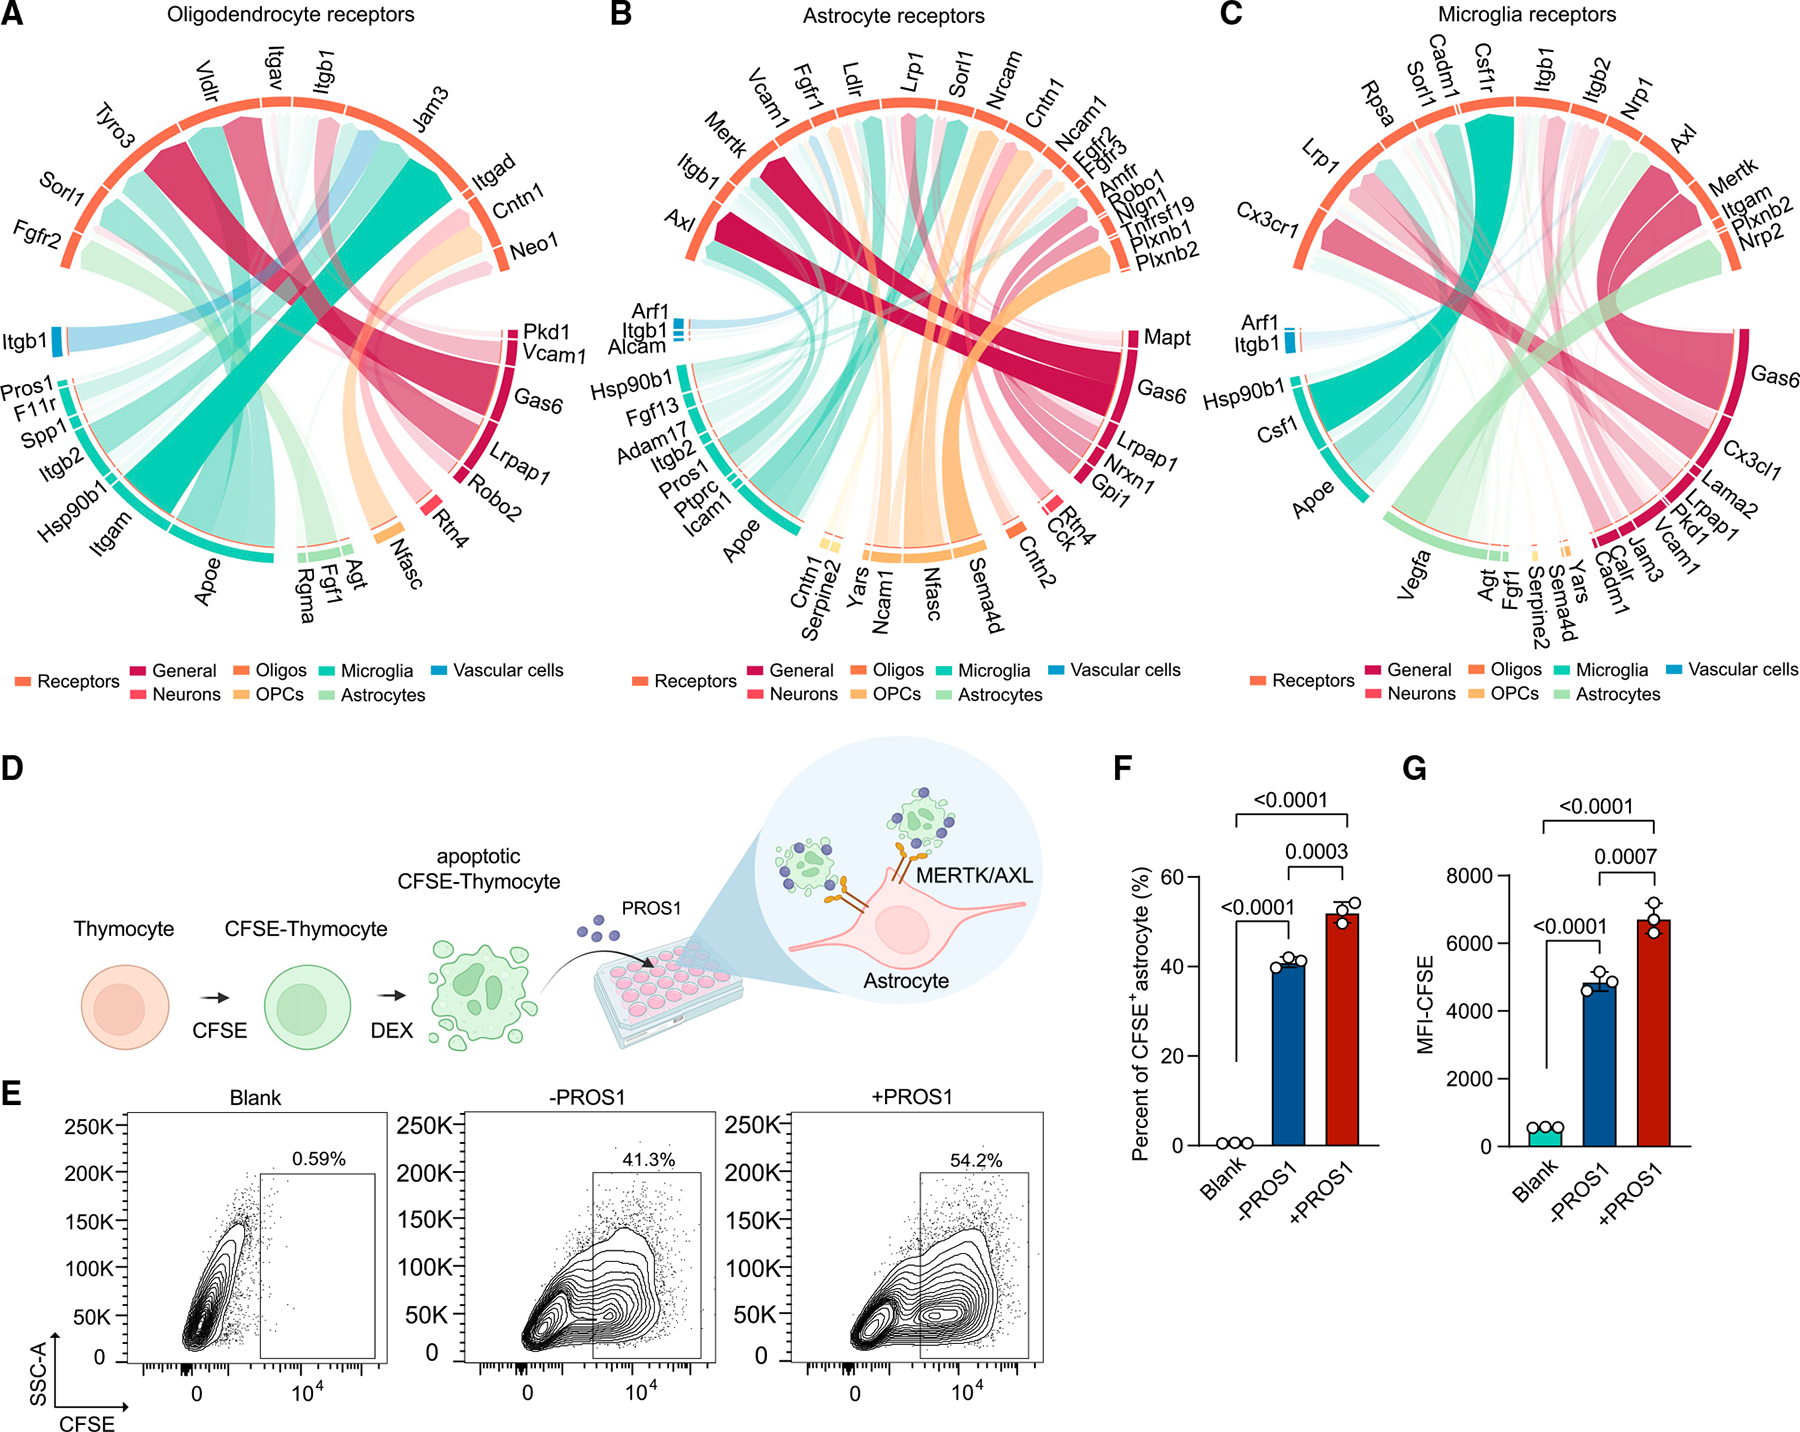
Figure 6. NicheNet analysis reveals cell-cell interactions elicited by demyelination.

(A–C) Circos plot showing links between predicted ligands from sender cells (bottom) with their associated receptors on receiver cells (top, tomato). Width and transparency of the blocks represent the prior interaction weight of the ligand-receptor interactions. Colors on the lower part of the plots represent cell types where ligands are mostly derived from: dark red, ligands expressed in multiple cell types (general); dark orange, neurons; orange, oligodendrocytes; light orange, OPCs; dark green, microglia; light green, astrocytes; dark blue, vascular cells.
(D) Schematic of the assessment of astrocyte phagocytosis. DEX, dexamethasone. Created with BioRender.com.
(E) Representative flow-cytometry plots showing CFSE+ phagocytic astrocytes. Numbers indicate percentage of cells in the indicated gates.
(F and G) Quantification of the phagocytic astrocytes by percentage of CFSE+ astrocytes (F) and CFSE mean fluorescence intensity (MFI) (G). Astrocytes without thymocyte incubation were included as blank control. Data are presented as mean ± SD. p value by one-way ANOVA with Tukey’s multiple comparisons test. n = 3 cell culture wells per group. Experiment was repeated three times.
See also Figure S7.
