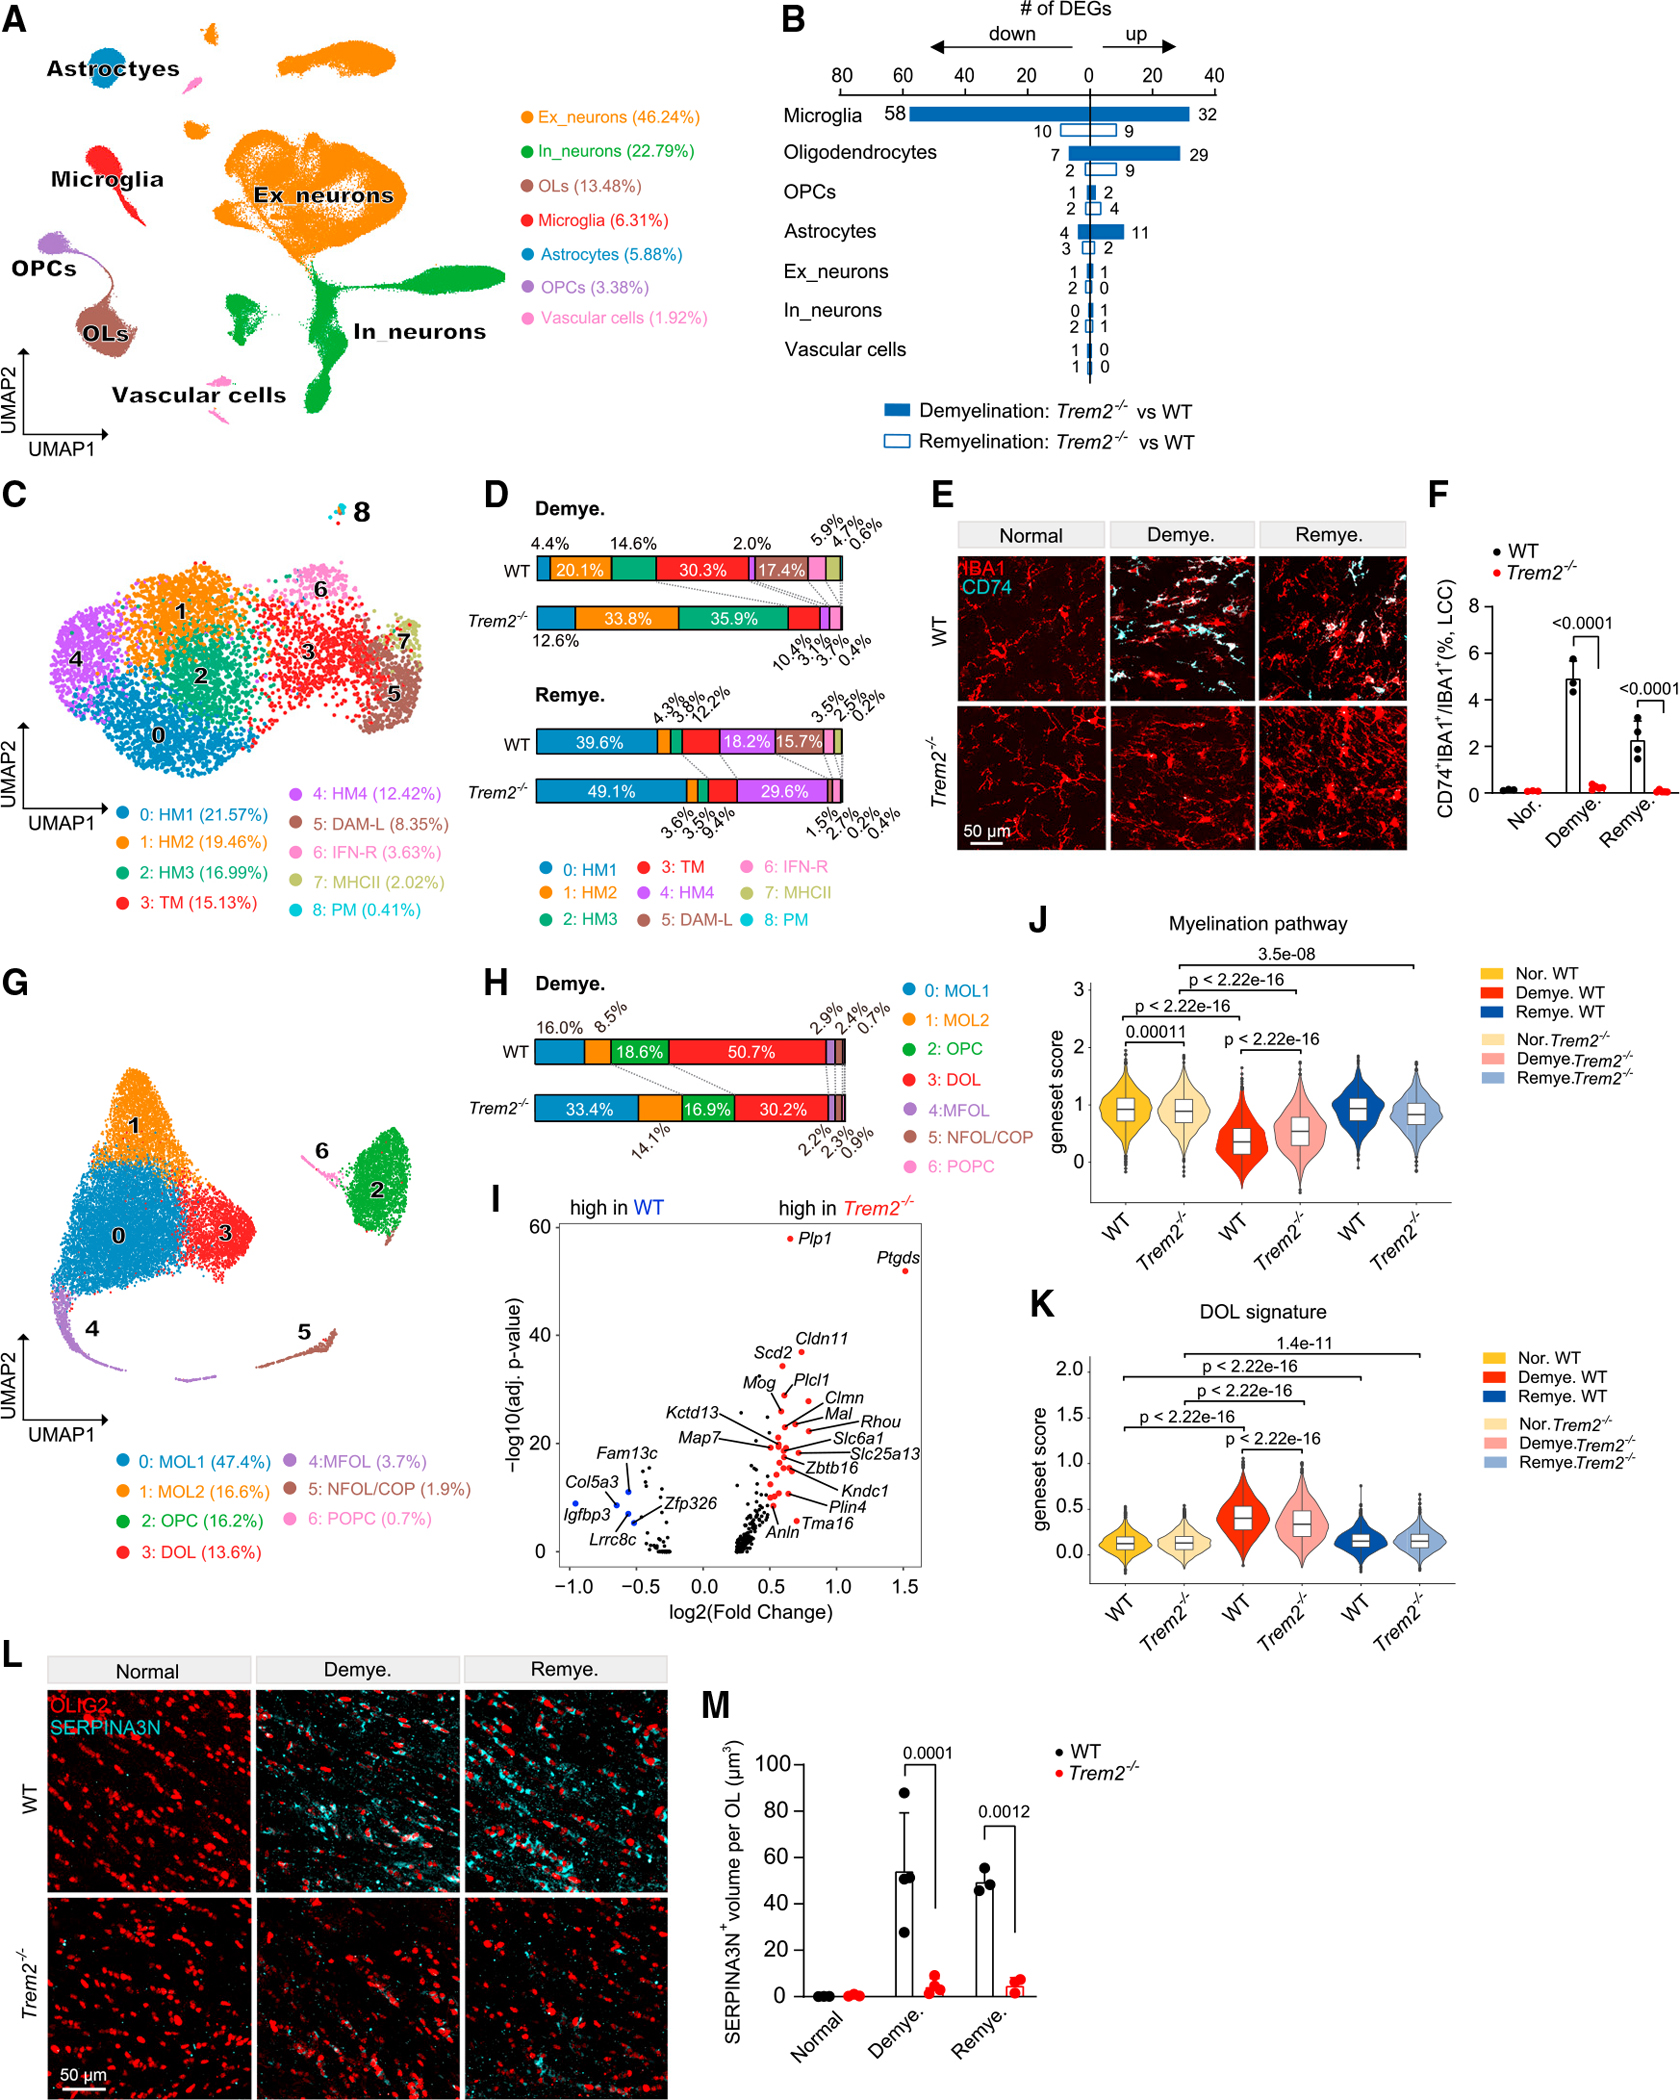
Figure 7. TREM2 deficiency indirectly impairs DOL induction.

(A) UMAP plot of 117,729 nuclei showing seven distinguished cell types of Trem2−/− mice and littermate WT controls. n = 3 mice per genotype per condition.
(B) Number of DEGs between Trem2−/− and WT mice in demyelination and remyelination. Log2(fold change) > 0.5, adjusted p < 0.05, non-parametric Wilcoxon rank-sum test, Bonferroni correction.
(C) UMAP plot of reclustered microglia. n = 5,567 total nuclei. n = 619 nuclei in normal WT, n = 594 nuclei in normal Trem2−/−, n = 1,848 nuclei in demyelination WT, n = 1,121 nuclei in demyelination Trem2−/−, n = 866 nuclei in remyelination WT, n = 519 nuclei in remyelination Trem2−/−.
(D) Distribution of microglia subsets in demyelination and remyelination across WT and Trem2−/− mice.
(E) Representative IF images of CD74 and IBA1 staining in the LCC of Trem2−/− and WT mice in each condition. CD74, cyan; IBA1, red. Scale bar, 50 μm.
(F) Quantification of CD74+IBA1+/IBA1+ ratio in LCC across different conditions. n = 3–5 mice per genotype per condition. Data are presented as mean ± SD. p value by two-way ANOVA with Tukey’s multiple comparisons test.
(G) UMAP plot of reclustered oligodendrocyte lineage cells. n = 19,523 total nuclei. n = 3,939 nuclei in normal WT, n = 4,013 nuclei in normal Trem2−/−, n = 2,966 nuclei in demyelination WT, n = 2,964 nuclei in demyelination Trem2−/−, n = 3,468 nuclei in remyelination WT, n = 2,173 nuclei in remyelination Trem2−/−.
(H) Distribution of oligodendrocyte lineage subsets in demyelination across WT and Trem2−/−.
(I) Volcano plot showing DEGs of mature oligodendrocytes in Trem2−/− vs. WT during demyelination. Log2(fold change) > 0.5, adjusted p < 0.05, non-parametric Wilcoxon rank-sum test, Bonferroni correction.
(J and K) Violin plots showing myelination pathway gene set score (J) and DOL signature score (K) in the oligodendrocytes in each condition. p value by Wilcoxon test. Gene sets used are listed in Table S3.
(L) Representative IF images of SERPINA3N and OLIG2 staining in the MCC of Trem2−/− and WT mice in each condition. SERPINA3N, cyan; OLIG2, red. Scale bar, 50 μm.
(M) Quantification of SERPINA3N+ volume per OLIG2+ oligodendrocyte in MCC across different conditions. Data are presented as mean ± SD. p value by two-way ANOVA with Tukey’s multiple comparisons test. n = 3–4 mice per genotype per condition.
See also Figures S8 and S9; Table S3, Tables S4 and S5.
