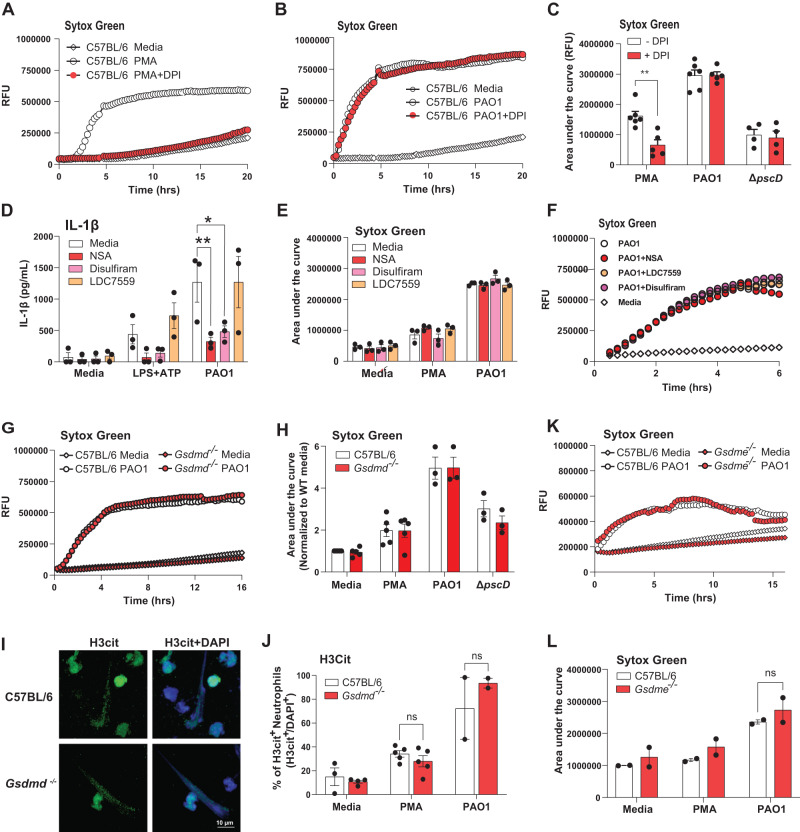
Fig. 5. PAO1 induced NETosis is independent of ROS, GSDMD and GSDME.
A–C Role of ROS in PMA stimulated, but not PAO1 infected peritoneal neutrophils. Representative time courses (A, B) and combined data from biological replicates (C). D-F IL-1β secretion (D) and NETosis (E) by peritoneal neutrophils incubated with reported GSDMD inhibitors necrosulfonamide (NSA), disulfiram, and LDC7559. NETosis was quantified by Sytox detection of extracellular DNA after 16 h (Area under the curve). Panel F is a representative time course. G–J Peritoneal neutrophils from C57BL/6 and Gsdmd-/- mice incubated 16 h with PMA, PAO1 or ∆pscD and extracellular DNA measured by Sytox. G representative time course, and H quantification of the area under the curve. I Representative images of citrullinated histone 3 (H3Cit) as an indicator of NETosis in PAO1 infected neutrophils (original and other images are in Fig. S4F). J Quantification of H3Cit+ neutrophils per high power field. K, L Representative time course and quantification of NETosis in C57BL/6 and Gsdme-/- mice. ** is <0.01, * is <0.05. Each data point represents one independent experiment (2-6 biological repeats). Error bars are mean +/- SEM. Statistical significance was assessed by 2-way ANOVA followed by Tukey’s post-test.

