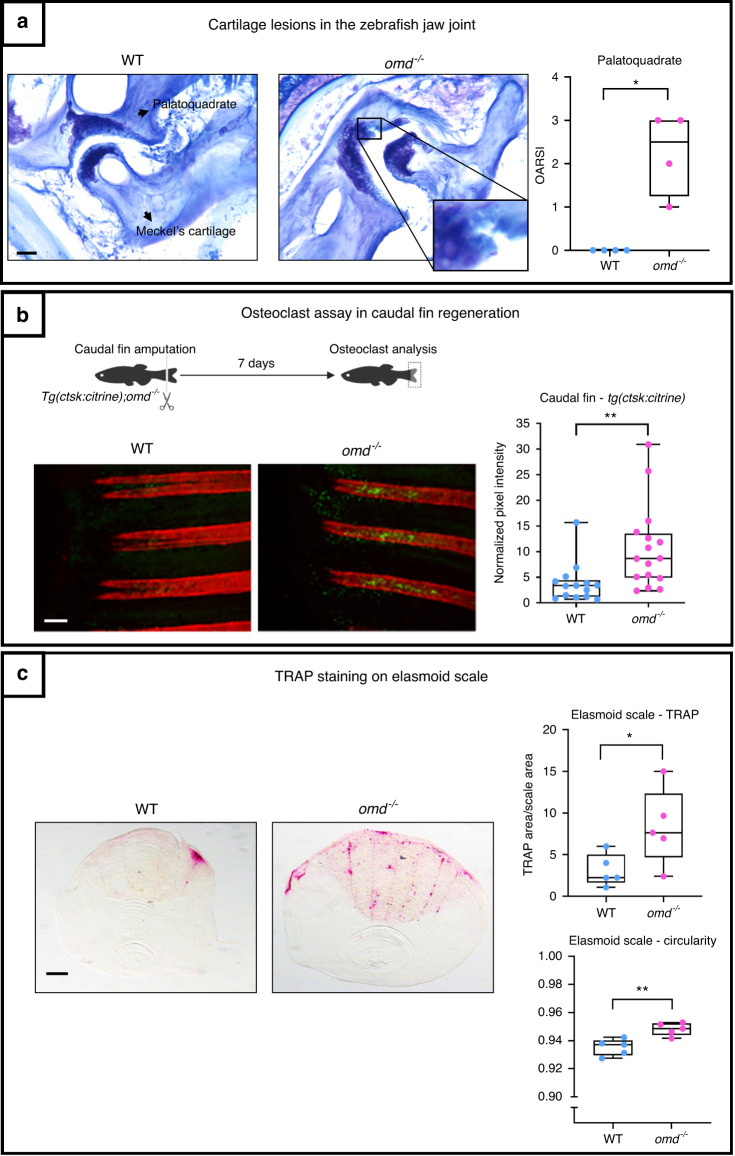
Fig. 7.
The mutant deficient for omd was generated through CRISPR/Cas 9. a Histology of the jaw joint was performed on 1-year-old zebrafish. The OARSI score of the palatoquadrate was attributed to the jaw joint stained with Toluidine blue with n = 4 for the WT and the mutant. The data were plotted as a box plot showing all points. Mann–Whitney test was performed with differences being considered significant at P values <0.05 (*P < 0.05). Scale bar = 200 µm. b The mutant line was crossed with the Tg(ctsk:Citrine) for the osteoclasts analysis during the caudal fin regeneration. The caudal fin of 1-year-old zebrafish was cut and the regenerating fin was observed after 7 days. The osteoclasts are represented in yellow-green from the ctsk:Citrine signal and the mineralized ray were stained with Alizarin red. The data were plotted as a box plot showing all points. The pixel intensity of the regenerating rays is plotted and normalized by the background intensity with n = 14 for the WT and n = 16 for the mutant from two independent experiments which were pooled to perform the unpaired Student’s t test with differences being considered significant at P values <0.05 (**P ≤ 0.01). Scale bar = 200 µm. c TRAP staining was performed on the elasmoid scales of 1.6-year-old zebrafish. The TRAP staining area was normalized with the total scale area. The TRAP staining and the circularity of the scales were assessed with ZFBONE—Fiji with n = 5 for the WT and the mutant and with 6 to 15 scales/zebrafish analyzed. Scale bar = 0.2 mm. The data were plotted as a box plot showing all points. Unpaired Student’s t test with differences being considered significant at P values <0.05 (*P < 0.05, **P ≤ 0.01)

