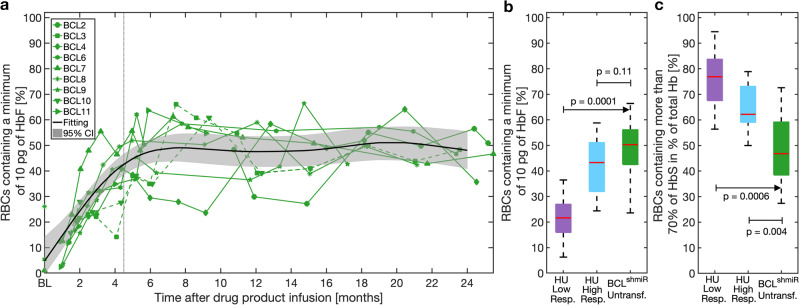
Fig. 1. HbF induction after BCL11A inhibition as compared to HU.
Panel a shows the proportion of RBCs containing a minimum of 10 pg of HbF per cell measured by flow cytometry in BCLshmiR after drug product infusion. Dotted green lines represent Transfused BCLshmiR (patients 3 and 10) while green solid lines represent the Untransfused BCLshmiR patients at baseline (when available) and after drug product infusion. The vertical dashed gray line indicates 4.5 months after drug product infusion, which corresponds to timepoints for which previously transfused RBCs were no longer detectable (HbA = 0%) in Untransfused BCLshmiR. For dotted green lines later than 4.5 months we show the percentage of RBCs containing a minimum of 10 pg of HbF among Untransfused RBCs. For timepoints earlier than ~4.5 months the percentage of RBCs containing a minimum of 10 pg of HbF reflects the presence of transfused RBCs. The black solid line shows a fitting for the Untransfused BCLshmiR obtained by a linear mixed-effects model, and the gray region indicates the 95% confidence interval for this linear mixed-effects model (see below). Panel b shows the difference in the proportion of RBCs containing a minimum of 10 pg of HbF between Untransfused BCLshmiR (n = 7) in green, HU High Responders (n = 10), and HU Low Responders (n = 8) in purple (median–IQR). Panel c shows the proportion of RBC containing more than 70% of HbS as a percentage of total Hb, as determined by flow cytometry based on HbF quantification (excluding HbA2), in Untransfused BCLshmiR after drug product infusion, for HU High Responders in blue, and HU Low Responders in purple. A linear mixed-effects model (described in the “Methods” subsection“Data analysis, statistics, and reproducibility”) was used to estimate the mean kinetics of HbF induction as a function of time for the seven non-transfused subjects. Boxplot properties and the method used to compute the p-values in this study are described in the “Methods” subsection “Data analysis, statistics, and reproducibility”. Source data are provided as a Source Data file.

