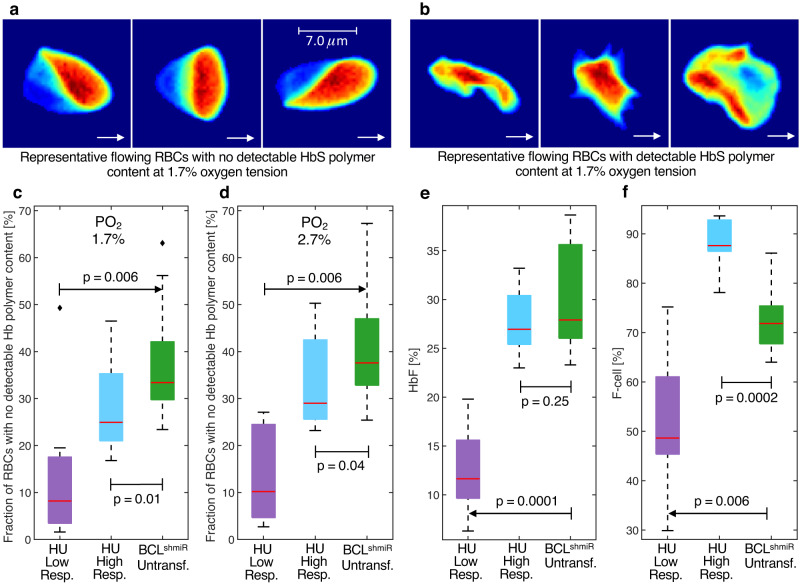
Fig. 2. Increased RBC fractions with no detectable Hb polymer content after BCL11A inhibition as compared to HU.
Panels a and b show representative RBC images from an HU-treated patient collected at 1.7% oxygen tension under shear forces in a microfluidic channel 20 microns wide and 8 microns deep. White arrows indicate the direction the cells were moving when the images were collected. Panel a shows RBCs with no detectable Hb polymer content, while panel b shows RBCs with a detectable polymer content. RBCs from panel a have most of their hemoglobin in the soluble state, and their shape is defined by their position relative to the wall (from left to right: closer to the top wall, at the center, and closer to the bottom wall) of the microfluidic channel and the resulting shear forces. RBCs from panel b have a significant amount of hemoglobin in the polymer state and their morphology (from left to right: elongated, holly leaf, and granular shapes) is altered by the dynamics of polymer aggregation upon deoxygenation. RBCs as shown in panels a and b were collected at 1.7% and 2.7% oxygen tensions for both Untransfused BCLshmiR and HU High Responders patients but with different fractions. Panels c and d show the fraction of RBCs with no detectable Hb polymer content at 1.7% and 2.7% oxygen tensions, respectively, measured in vitro in Untransfused BCLshmiR (n = 7; green boxes), in HU High Responders (n = 10; blue boxes), and in HU Low Responders (n = 8; purple boxes). Panels e and f show the HbF percentages (of total Hb) as measured by HPLC, and the proportion of F-cells as measured by flow cytometry. Boxplot properties and the method used to compute the p-values in this study are described in the “Methods” subsection “Data analysis, statistics, and reproducibility”. Source data are provided as a Source Data file.

