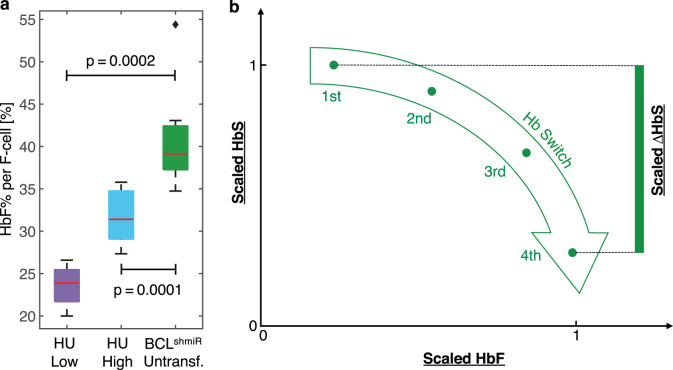
Fig. 3. BCL11A inhibition induces higher levels of HbF content per F-cell compared to HU and suggests an effective reversal of the fetal-to-adult Hb switch.
Box plots in panel a show HbF expressed as the percentage of total HbF per F-cell for Untransfused BCLshmiR (n = 7; green), HU High Responders (n = 10; blue), and HU Low Responders (n = 8; purple). The percentages of total HbF per F-cell are estimated as the ratio of total HbF% to F-cell% and assume that the HbF content in the non-F-cells is negligible. Panel b shows a schematic of the expected result of affecting the physiological Hb switch, with the green arrow representing the Hb switch path where HbF content increases while HbS content decreases. The y-axis and x-axis correspond to normalized HbF and HbS levels, for instance from scaled flow cytometric fluorescence intensities as shown in Fig. 4 with the green dots representing quartiles of the single-cell fluorescence intensity distribution. Boxplot properties and the method used to compute the p-values in this study are described in the “Methods” subsection “Data analysis, statistics, and reproducibility”. Source data are provided as a Source Data file.

