
Figure 1. Analysis Workflow for the Coordinated Deformation Model (CDM).
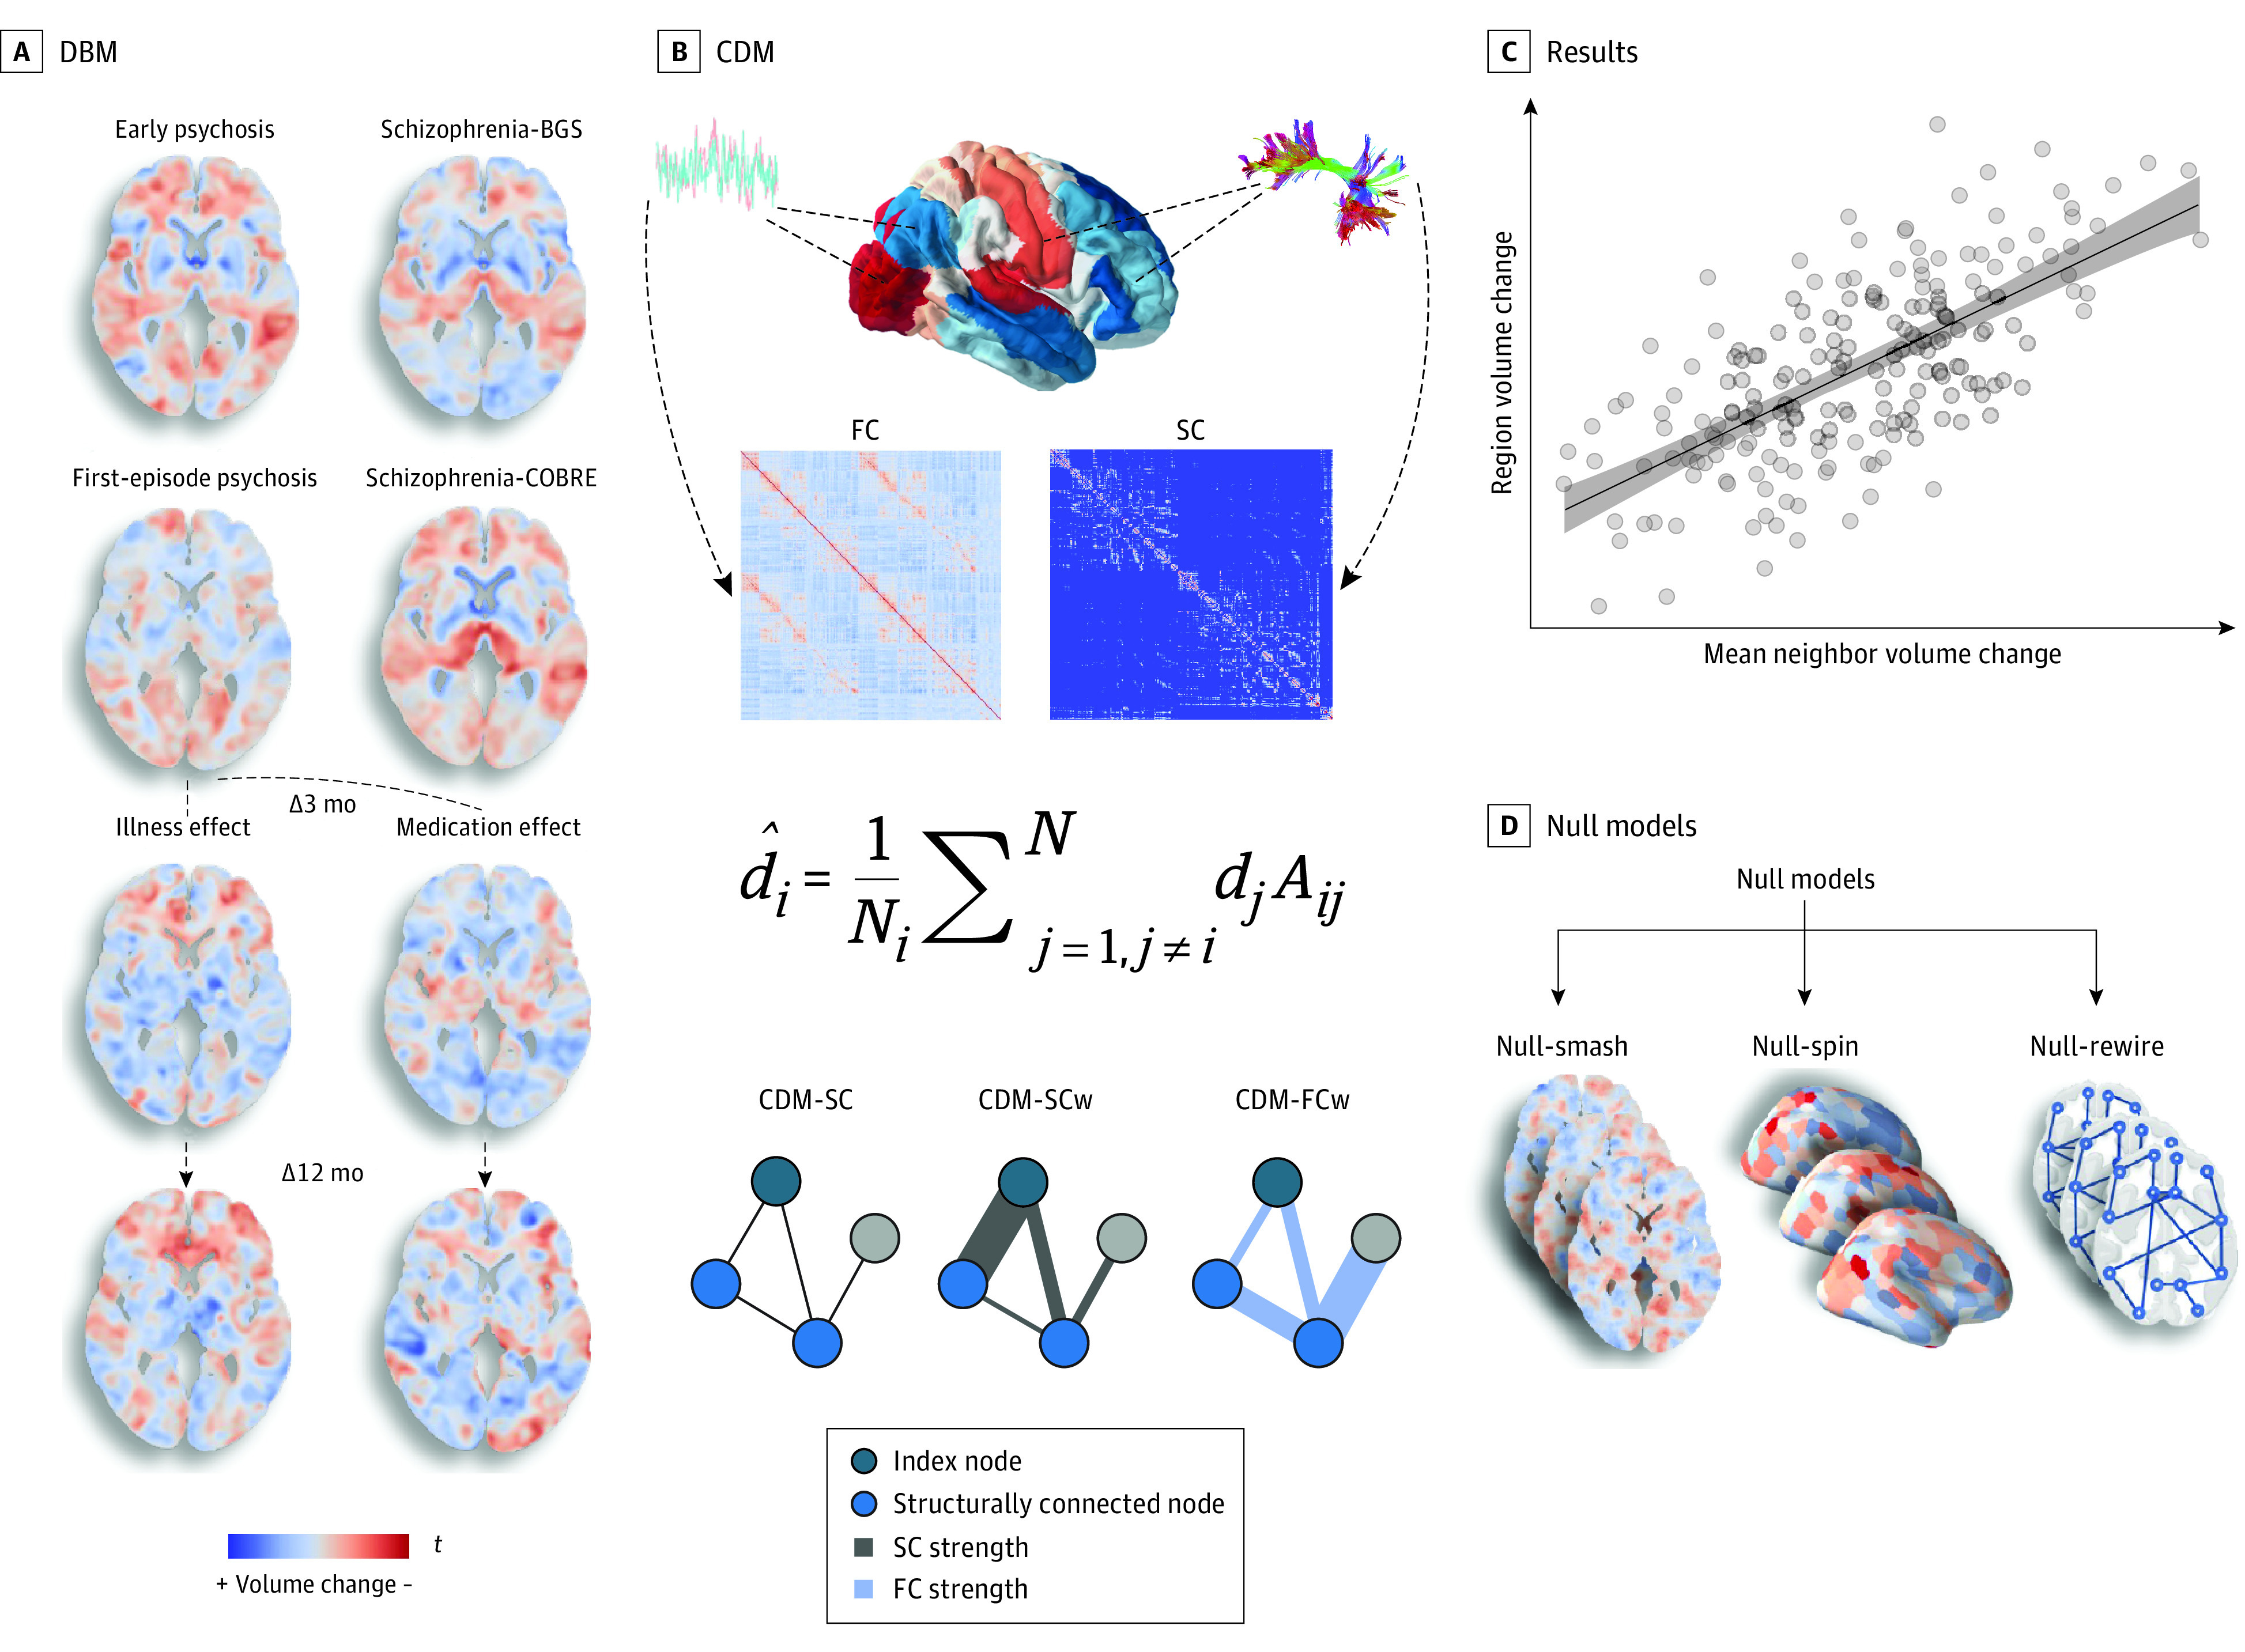
A, We derived voxelwise gray matter volume (GMV) estimates using deformation-based morphometry (DBM). Five separate contrasts were specified using a robust marginal model to infer baseline GMV differences and longitudinal GMV changes associated with illness and antipsychotic medication at 3 and 12 months. Cross-sectional contrasts were specified such that positive values (in red) in the resulting voxelwise t statistic maps indicate lower volume in patients compared with controls. For the illness-related longitudinal contrasts, positive values (in red) in the resulting voxelwise t statistic maps indicate greater longitudinal GMV decline in patients receiving placebo compared with controls. For the medication-related longitudinal contrasts, positive values in the resulting voxelwise t statistic maps indicate greater longitudinal GMV decline in patients receiving medication compared with both those receiving placebo and controls. Schizophrenia data sets included participants in the BrainGluSchi (BGS) and COBRE studies. Δ indicates change from baseline. B, The contrast statistics were mapped to a brain parcellation comprising 332 regions, and diffusion and functional magnetic resonance imaging data from an independent healthy sample were used to generate sample-averaged functional coupling (FC) and structural connectivity (SC) matrices. These matrices were used to model mean volume changes in structurally connected neighbors. Under the CDM, the estimated deformation of a node, d̂i, is modeled as a weighted sum of the deformation values observed in its structurally connected neighbors, di (shown as light blue nodes in the example graphs). The weights are given by the adjacency matrix, Aij. Three different matrices were used, yielding 3 CDM variants: (1) a model denoted as CDM-SC, in which Aij = 1 if regions i and j share a connection and Aij = 0 otherwise; (2) a model denoted as CDM-SCw in which the elements of Aij correspond precisely to the weighted SC matrix, such that the contribution of each neighbor is weighted by the strength of its structural connectivity to the index node; and (3) a model denoted CDM-FCw, in which the elements of Aij correspond precisely to the weighted FC matrix, such that the contribution of each neighbor is weighted by its FC with the index node. C, Model performance was evaluated using the product-moment correlation between regional estimates of observed and estimated GMV differences. D, We also compared model performance with 3 benchmark null models accounting for spatial autocorrelations in the deformation maps (Null-smash and Null-spin) and basic topological properties of the connectome (Null-rewire) (see Statistical Analysis subsection of the Methods section and eMethods 9 in Supplement 1).