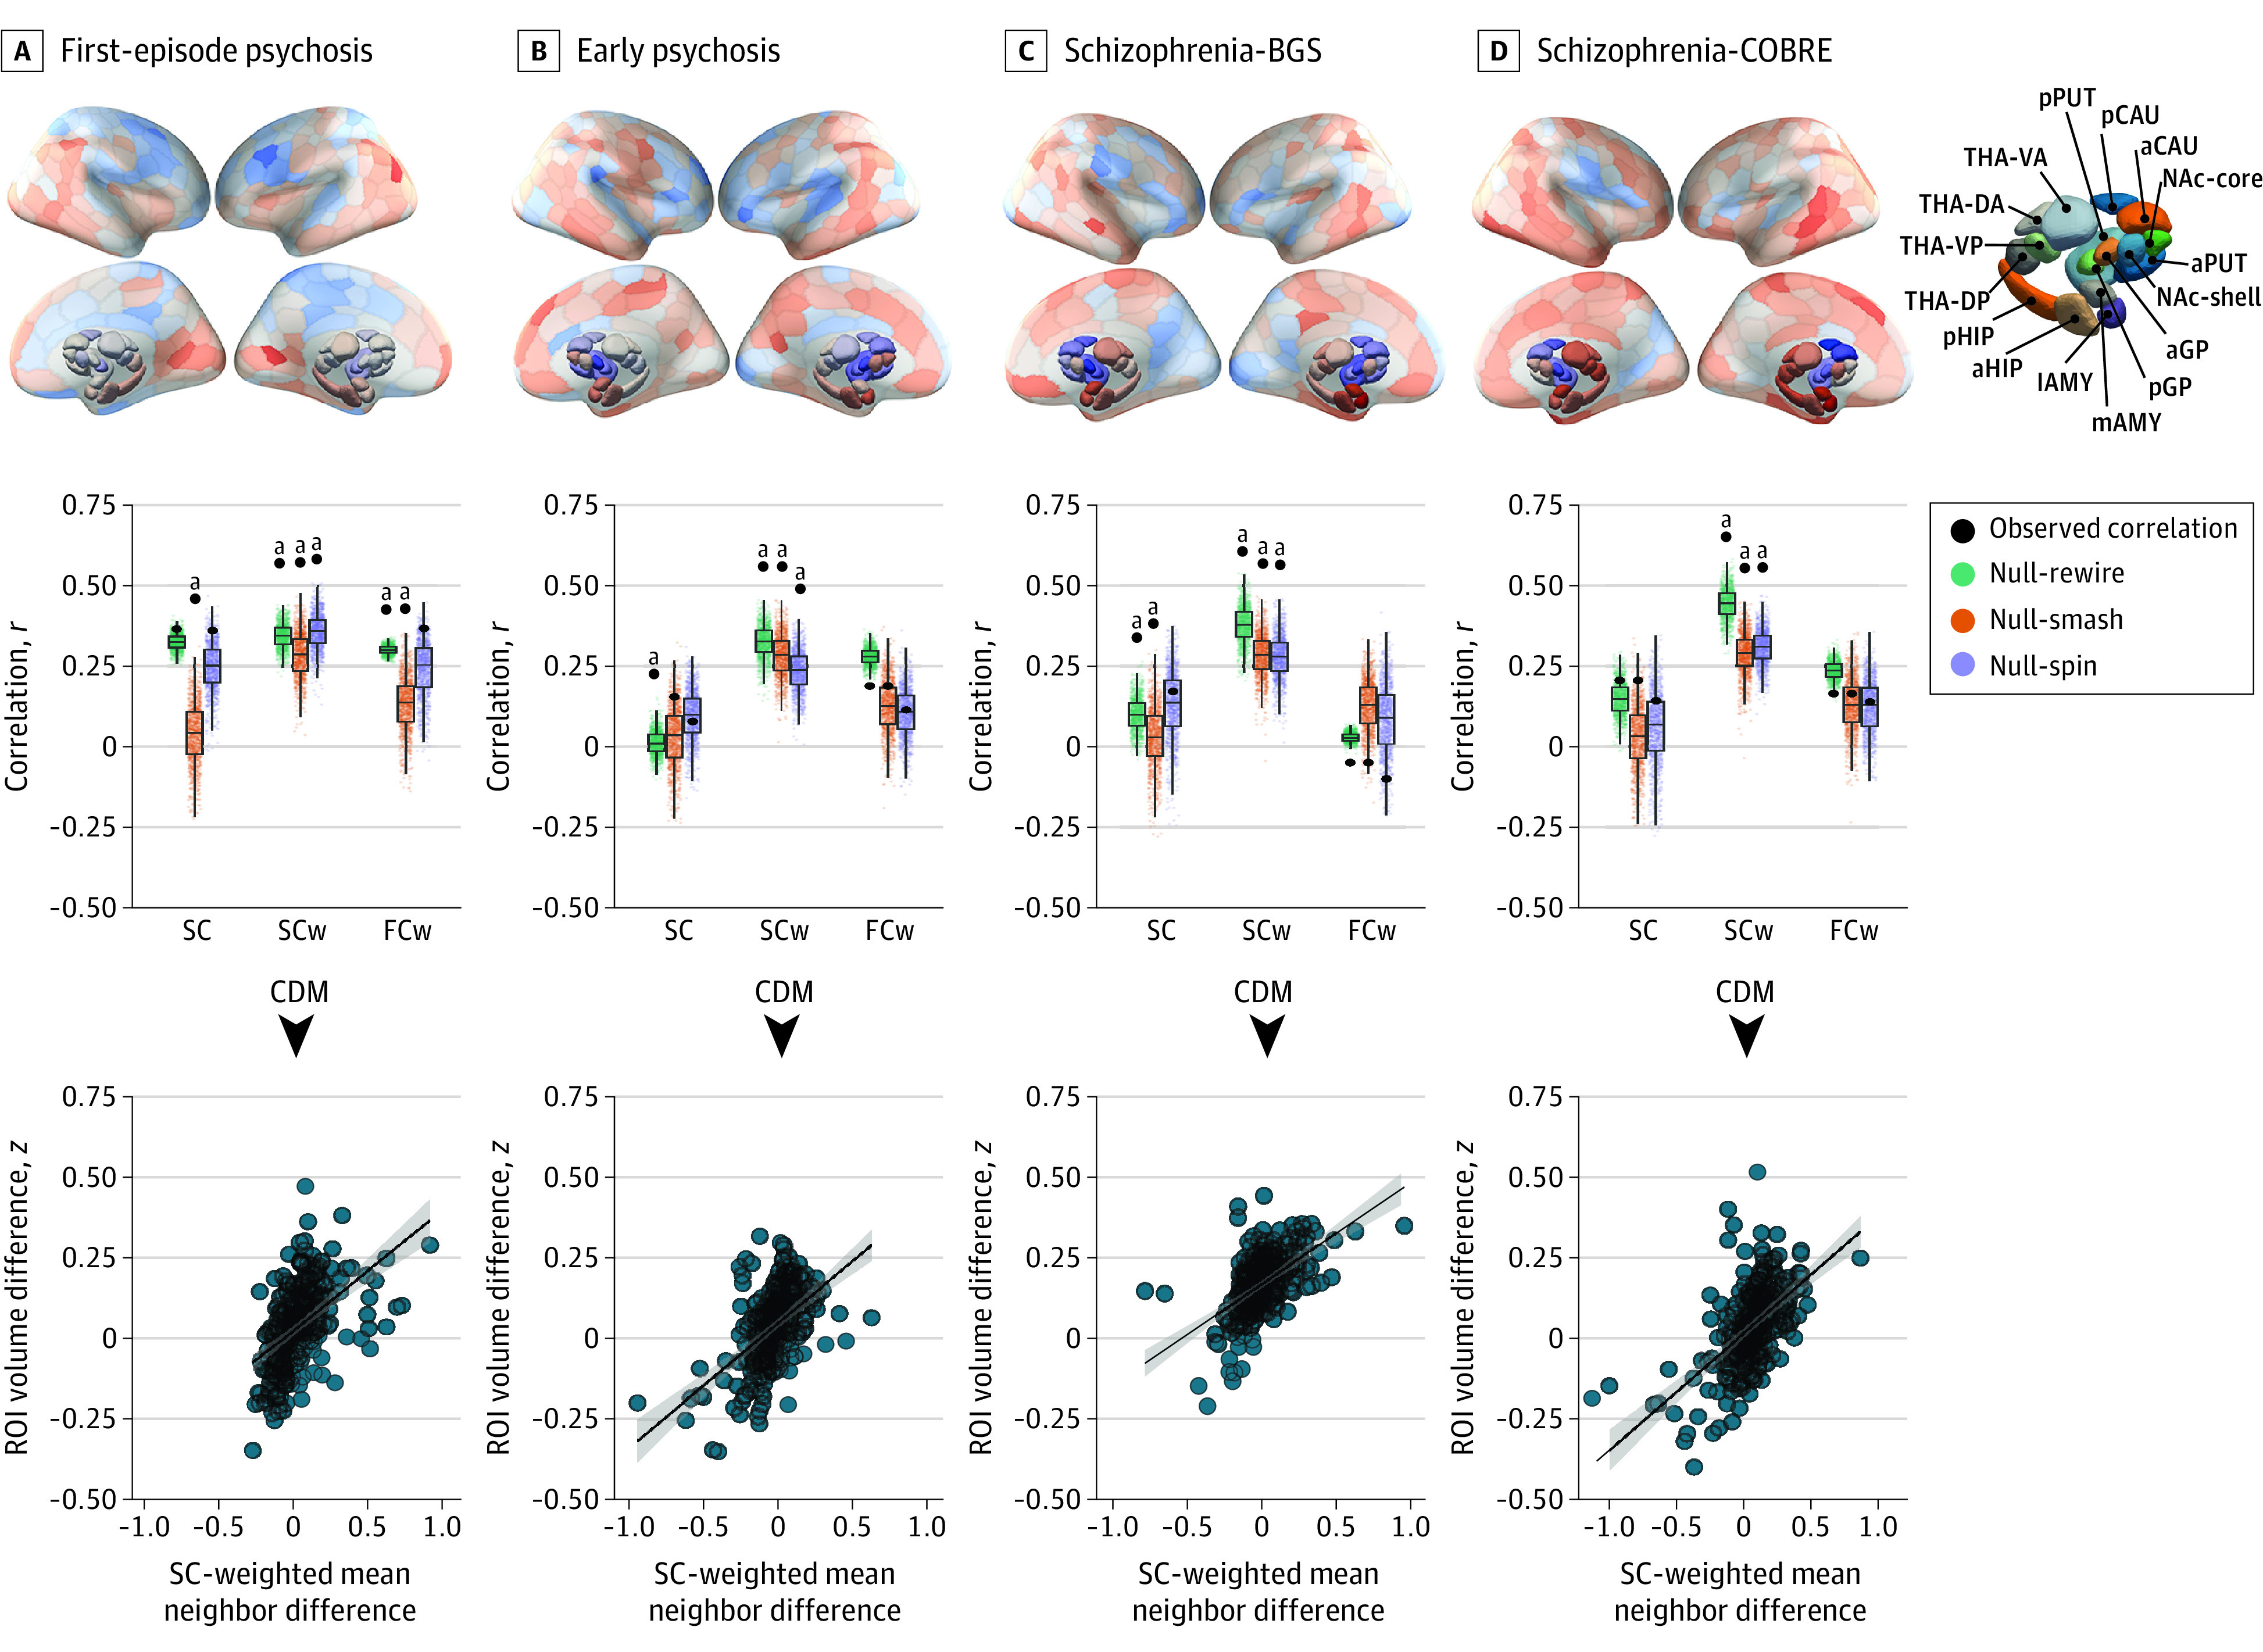
Figure 2. Baseline and Longitudinal Illness-Related Gray Matter Volume Changes Are Constrained by Connectome Anatomy.

Top row, The contrast statistics for 4 cross-sectional contrasts (first-episode psychosis, early psychosis, schizophrenia-BrainGluSchi [BGS], and schizophernia-COBRE data sets) mapped to a brain parcellation comprising 332 regions. a Indicates anterior; AMY, amygdala; CAU, caudate nucleus; d, dorsal; DA, dorsoanterior; DMN, default mode network; DorsAttn, dorsal attention network; DP, dorsoposterior; FPN, frontoparietal network; GP, globus pallidus; HIP, hippocampus; l, lateral; Lim, cortical limbic network; m, medial; MTL, medial-temporal lobe (amygdala and hippocampus); NAc, nucleus accumbens; p, posterior; SomMot, somatomotor network; Stri, striatum; PUT, putamen; and THA, thalamus. Middle row, Performance of the equally weighted (SC), structural connectivity–weighted (SCw), and functional coupling–weighted (FCw) coordinated deformation models (CDMs) relative to the Null-smash, Null-spin, and Null-rewire benchmarks. Black circles indicate the observed product-moment correlations between estimated and actual regional deformation values for each model. Note that the observed value used for comparison against the Null-spin models is different because the subcortex was excluded. Bottom row, Scatterplots of the association between observed and estimated regional volume deformation values for the best-performing CDM-SCw model at each time point. ROI indicates region of interest.
aP < .016.
