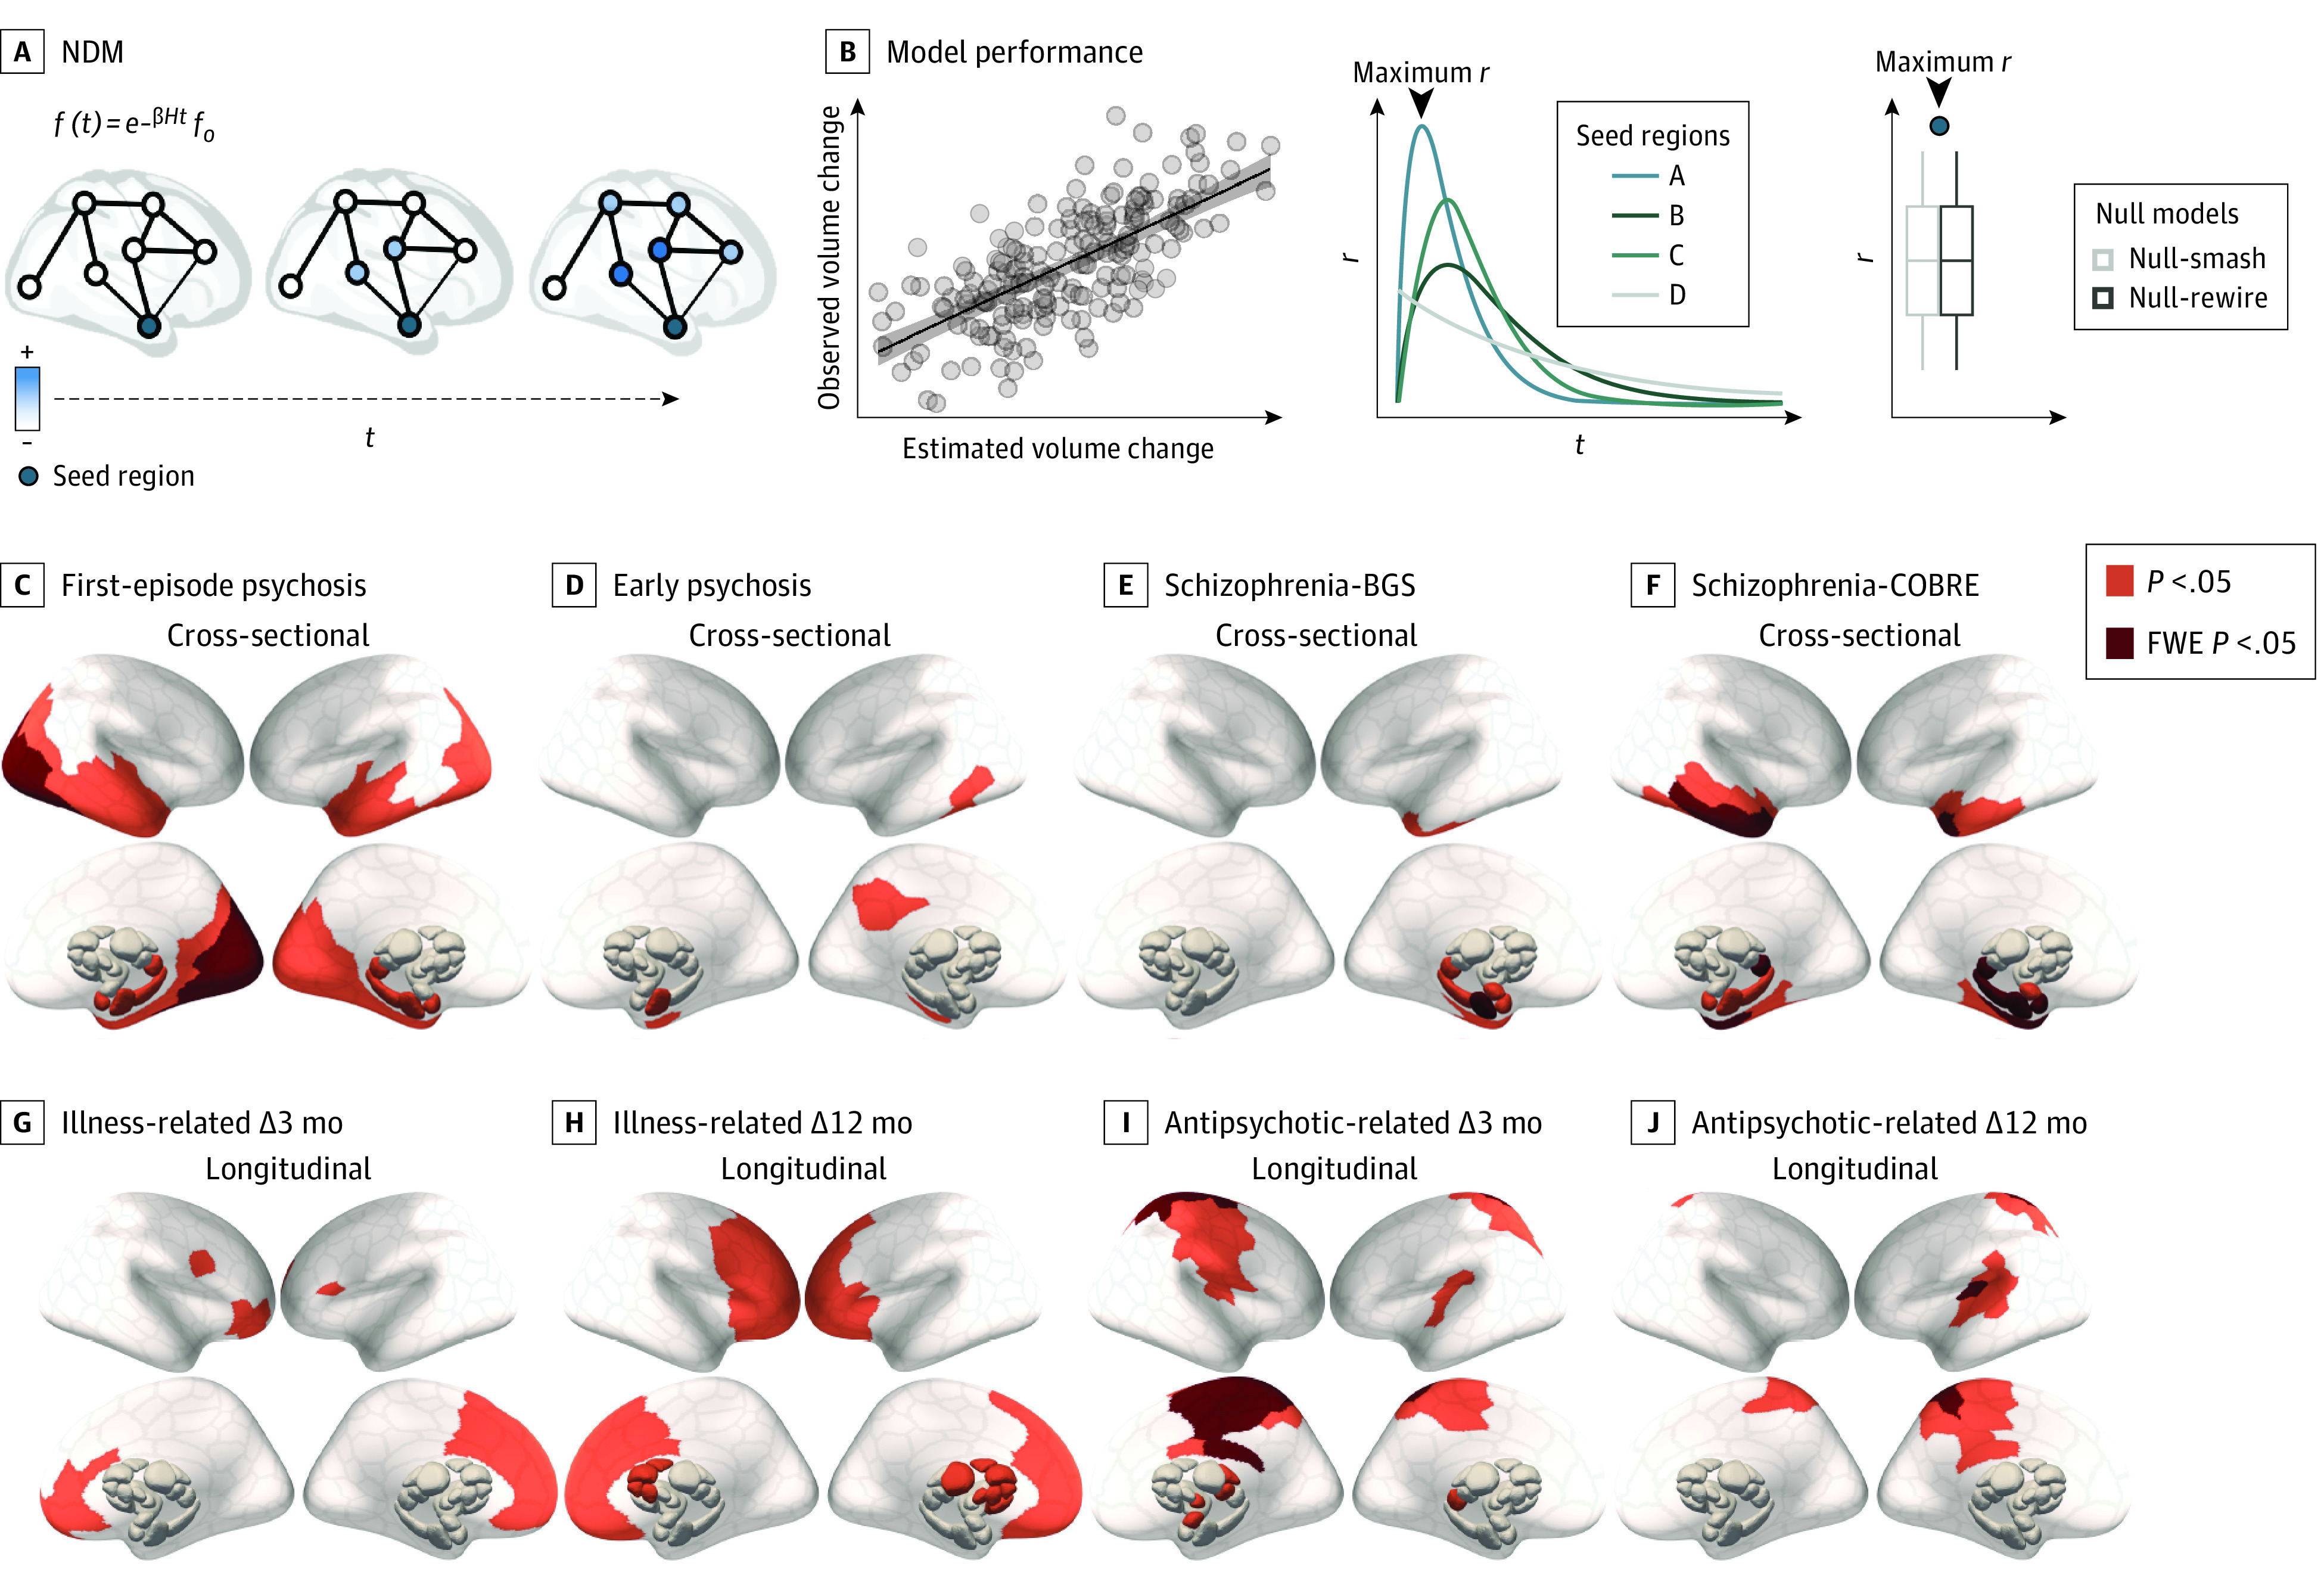
Figure 4. Regional Epicenters of Gray Matter Volume (GMV) Loss.

A, Epicenters were defined as potential sources of pathological volume loss from which GMV reductions spread (blue) to affect structurally connected areas. To identify such regions, we simulated a spreading process using a network diffusion model (NDM). Schizophrenia data sets included participants in the BrainGluSchi (BGS) and COBRE studies. B, Using each of the 332 parcellated regions as a seed, we retained the maximum correlation between the simulated and observed GMV abnormalities (maximum r). For each contrast, we then compared maximum r values for each region to a distribution of maximum r values from 2 benchmark null models accounting for spatial autocorrelations in the deformation maps (Null-smash) and basic topological properties of the connectome (see Statistical Analysis subsection of the Methods section [NDM]). Regional epicenters with significantly greater maximum r than a spatially constrained null model (orange indicates P < .05; red, familywise error [FWE] P < .05) are shown for cross-sectional (C-F) and longitudinal (G-J) effects. Results using Null-rewire benchmark models and scatterplots of observed and estimated volume abnormalities are provided in eFigure 3 in Supplement 1.
