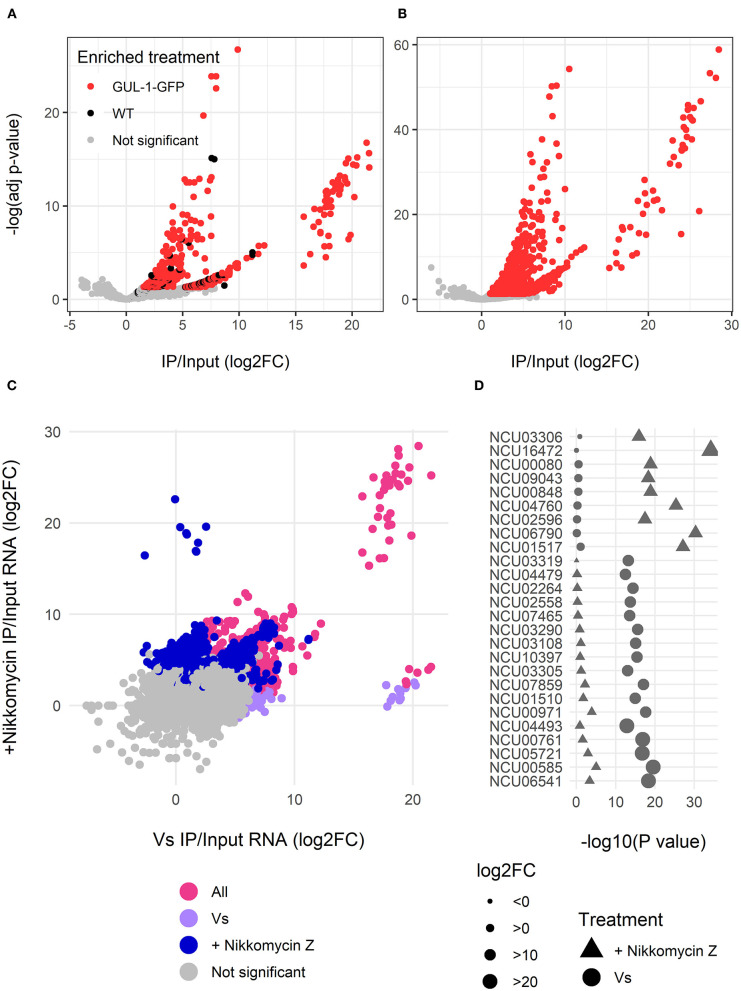
Figure 2.
GUL-1 can interact with over 2,000 mRNAs. RNAseq analysis of transcripts immunprecipitated with GUL-1-GFP. Log2 fold-change of GFP pull-down enriched RNAs were compared to wild-type and –Log (adjusted P-value) of (A) standard growth medium (Vs) and (B) Nikkomycin Z treatment. Colors indicate the genes significantly enriched in GFP-labeled GUL-1 (red), but not enriched in wild-type GUL-1 IPs (in black). (C) A comparison of enrichment (log2FC) between standard growth conditions (Vs) and Nikkomycin Z treatments was also carried out. Colors indicate transcripts enriched in Vs (magenta), Nikkomycin Z (blue), or in both treatments (pink). Some transcripts were exceptionally enriched in GUL-1 GFP-tagged IPs when compared to wild-type, with a log2 FC > 15, and are grouped within elliptical area. (D) The predictive association between highly enriched (log2FC > 15) GUL-1-GFP immunoprecipitated transcripts. The significance of the enrichment, –Log (adjusted P-value), for the Vs (circles) or Nikkomycin Z (triangles) treatments, is shown as a comparison for enrichment of the same transcript in the corresponding treatments. Symbol size indicates relative abundance (log FC) of enrichment and the colors signify the enriched treatment as in panel (C). Data for all transcripts can be found in Supplementary Table 4.

