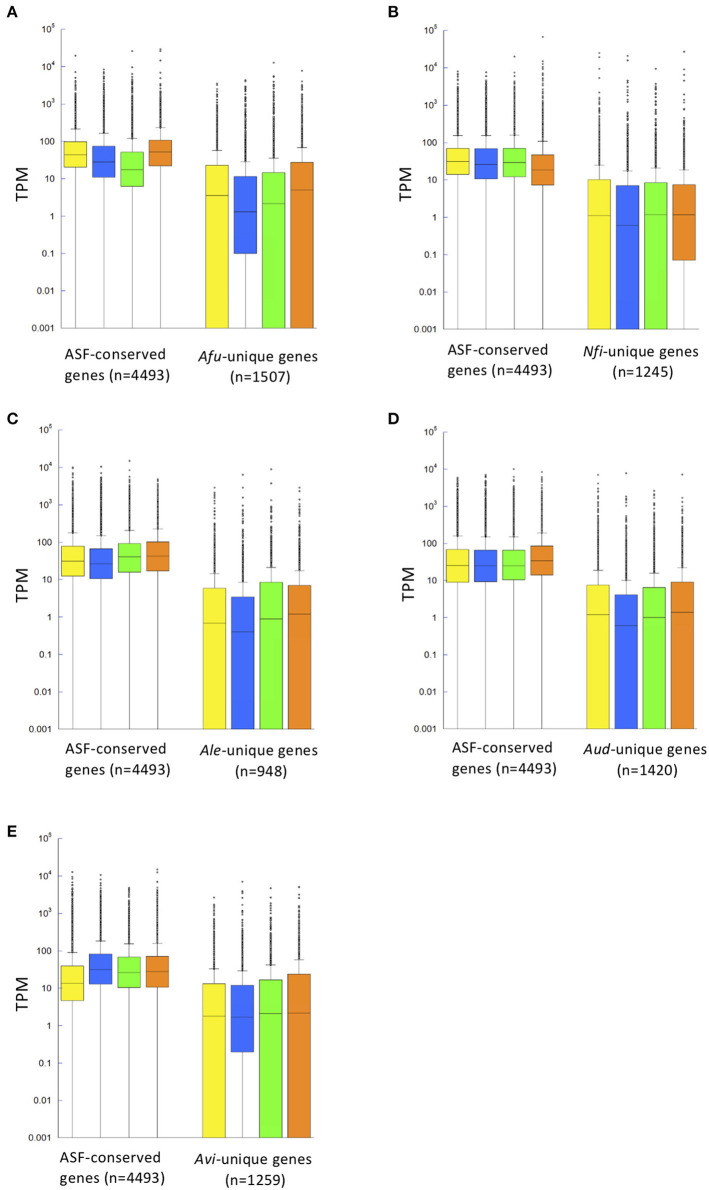
Figure 3.
Distribution of gene expression levels shown in a box plot. Gene expression patterns of ASF-conserved genes as the core genome (n = 4,493) and species-unique genes are shown for A. fumigatus (A), N. fischeri (B), A. lentulus (C), A. udagawae (D), and A. viridinutans (E) in four different conditions [potato dextrose broth (PDB), Czapek-Dox medium (CD), Sabouraud broth (SB), and potato dextrose agar (PDA)], indicated by yellow, blue, green, and orange boxes, respectively. Gene expression levels are described in Transcripts Per Kilobase Millions (TPM) obtained in RNA-sequencing analysis. The box plot graph is drawn using PlotsOfData (https://huygens.science.uva.nl/PlotsOfData/) (Postma and Goedhart, 2019).

