Figure 6.
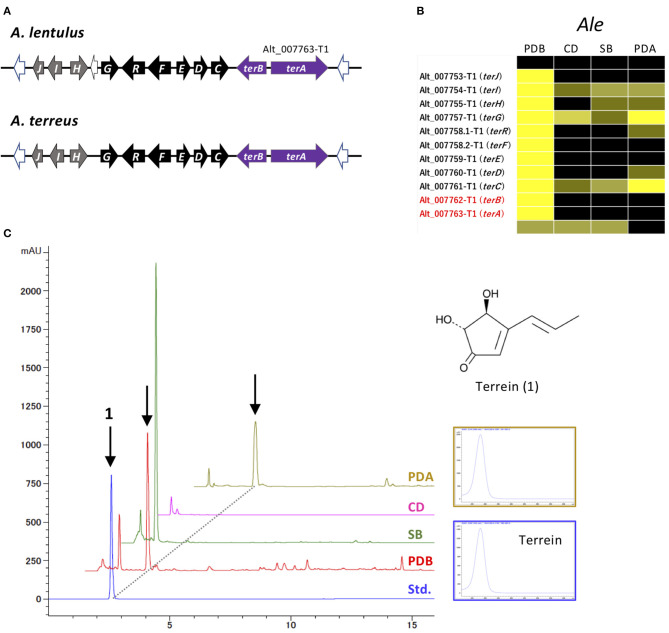
Characterization of the ter cluster and terrein production in A. lentulus. (A) Schematic structure of the ter cluster in A. lentulus and A. terreus. The SM backbone genes (PKSs) are indicated by purple arrows. Genes (terG, terH, terI, and terJ) whose involvement in terrein production remains obscure in A. terreus are indicated by gray arrows. (B) The expression profiles of ter genes in A. lentulus shown using a heat map. (C) The production of terrein in A. lentulus. The strains were cultivated in PDB, SB, CD, and PDA, and ethyl acetate-derived culture extracts were analyzed using high-performance liquid chromatography. Terrein (1) production was identified by comparison with the standard compound (Std.). The corresponding peaks are indicated by arrows, and the UV spectrum from a PDA culture is compared with that of the standard compound.

