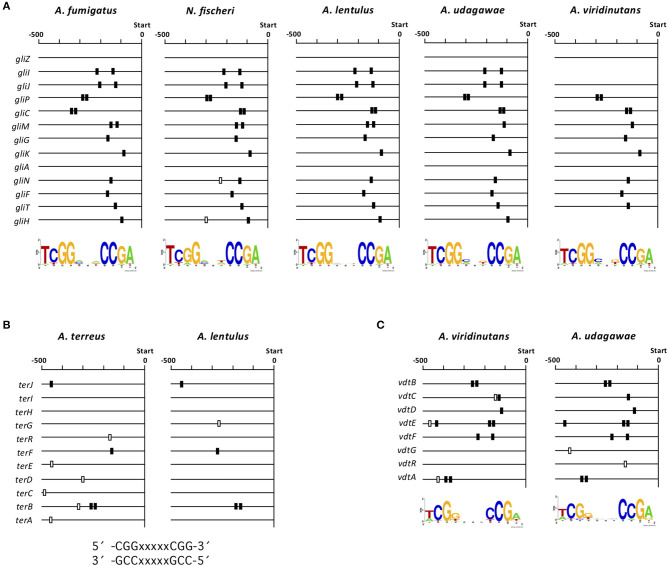
Figure 8.
Consensus sequences in the promoter regions of gli, ter, and vdt genes. (A) The consensus sequences were detected in the 13 gli genes in each species using BioProspector (Release 2), and the top hit motifs are shown under the map. The position of the sequence (TCGGNNNCCGA) is indicated by a box. The black boxes indicate consensus sequences that were considered to correspond to those in the other species tested. (B) Consensus sequences were sought in the 11 ter genes in A. lentulus and A. terreus by manual inspection. The positions of the reported consensus sequences (CCGNNNNNCCG and CGGNNNNNCGG) in the cluster is indicated by black or white boxes. (C) Consensus sequences were detected in the eight vdt genes in A. viridinutans and A. udagawae using BioProspector (Release 2), and the top hit motifs are shown under the map. Positions of the sequence (TCGGNNNCCGA) are indicated by black or white boxes. −500, 500-bp upstream from the translational initiation site of each gene.

