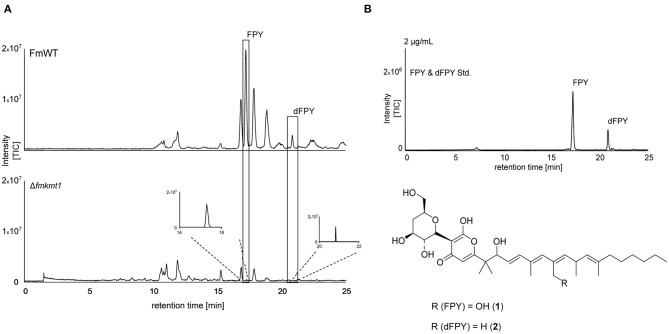
Figure 3.
Fusapyrone (FPY) and deoxyfusapyrone (dFPY) chemical profiles in F. mangiferae. (A) HPLC-HRMS chromatograms of FPY (1) and dFPY (2) production in the FmKMT1 deletion strain (Δfmkmt1) compared to the wild-type strain (FmWT). For this, FmWT and three independent Δfmkmt1 strains were cultivated in FPY-inducing media for 7 days at 30°C. Experiments were performed in triplicates. The measurement of fungal supernatants show that only traces of FPY and dFPY are produced by Δfmkmt1 compared to FmWT. (B) HPLC-HRMS chromatogram of FPY and dFPY standards (applied in a concentration of 2 μg/mL). Structures of the γ-pyrones FPY and dFPY are shown below. TIC chromatograms (positive ESI-mode) range from m/z 100 to 1,000.

