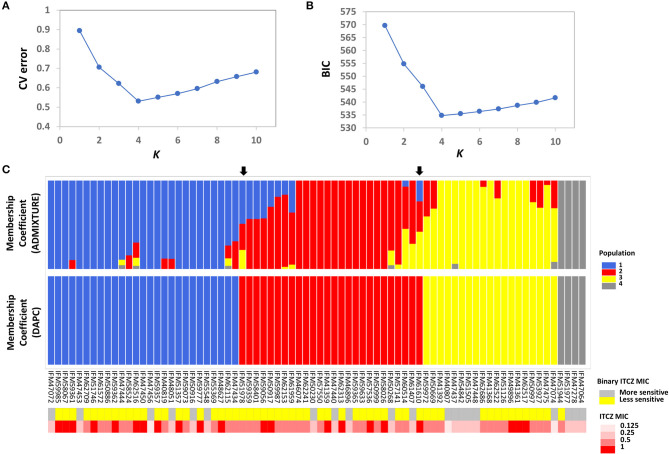
Figure 1.
Population structure and ITCZ sensitivity of the 76 Japanese clinical Aspergillus fumigatus Isolates. (A) The optimal number of genetic clusters (K, X-axis) inferred by ADMIXTURE using cross validation procedure (CV error, Y-axis). (B) The optimal number of genetic clusters (K, X-axis) inferred by DAPC using Bayesian Information Criterion (BIC, Y-axis). (C) Membership coefficients (Y-axis) for each of the 76 isolates (X-axis) from ADMIXTURE and DAPC for K = 4. The two black arrows indicate the two isolates that are assigned into different clusters by ADMIXTURE and DAPC. Population 1, 2, 3, and 4 are colored as blue, red, yellow, and gray, respectively. Binary ITCZ MIC assignment and quantitative ITCZ MIC values are depicted in the upper and lower panels below the membership coefficient plots, respectively. For binary ITCZ MIC, individuals are coded as either more-sensitive (MIC < 0.5, gray) or less-sensitive (MIC ≥ 0.5, yellow).

