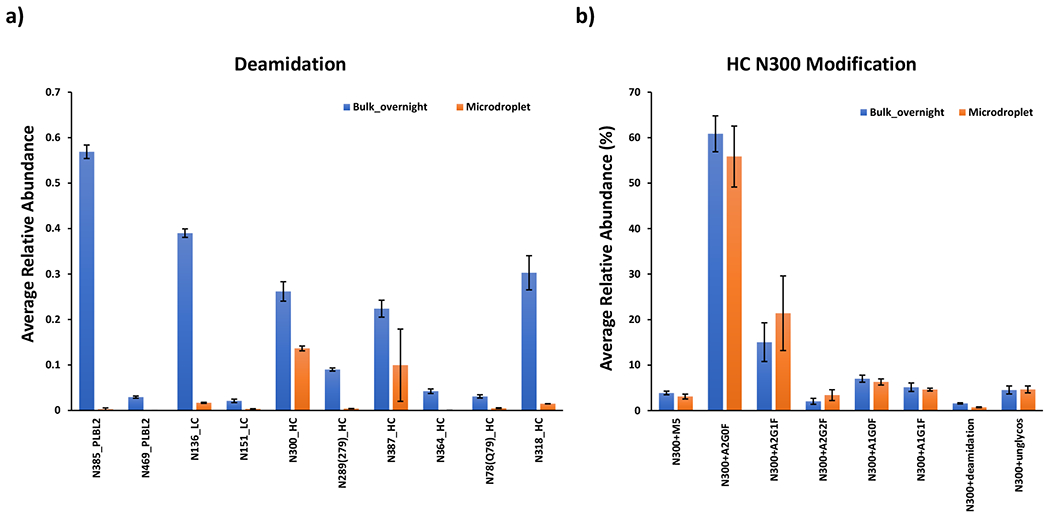
Figure 5.

Averaged relative abundances of (a) deamidation for mAb and PLBL2 and (b) glycosylation for mAb heavy chain N300 under different digestion conditions. Averaged relative abundance was calculated as the intensity ratio of one modified peptide to the intensity sum of modified and native peptides. Peak intensities of native and modified peptides were recorded after manually searching of +2 charge forms of each peptide from MS1 spectra with 5ppm mass accuracy tolerance. Standard deviations from the reported mean shown are for n = 3 digestion replicates.
