
Figure 5.
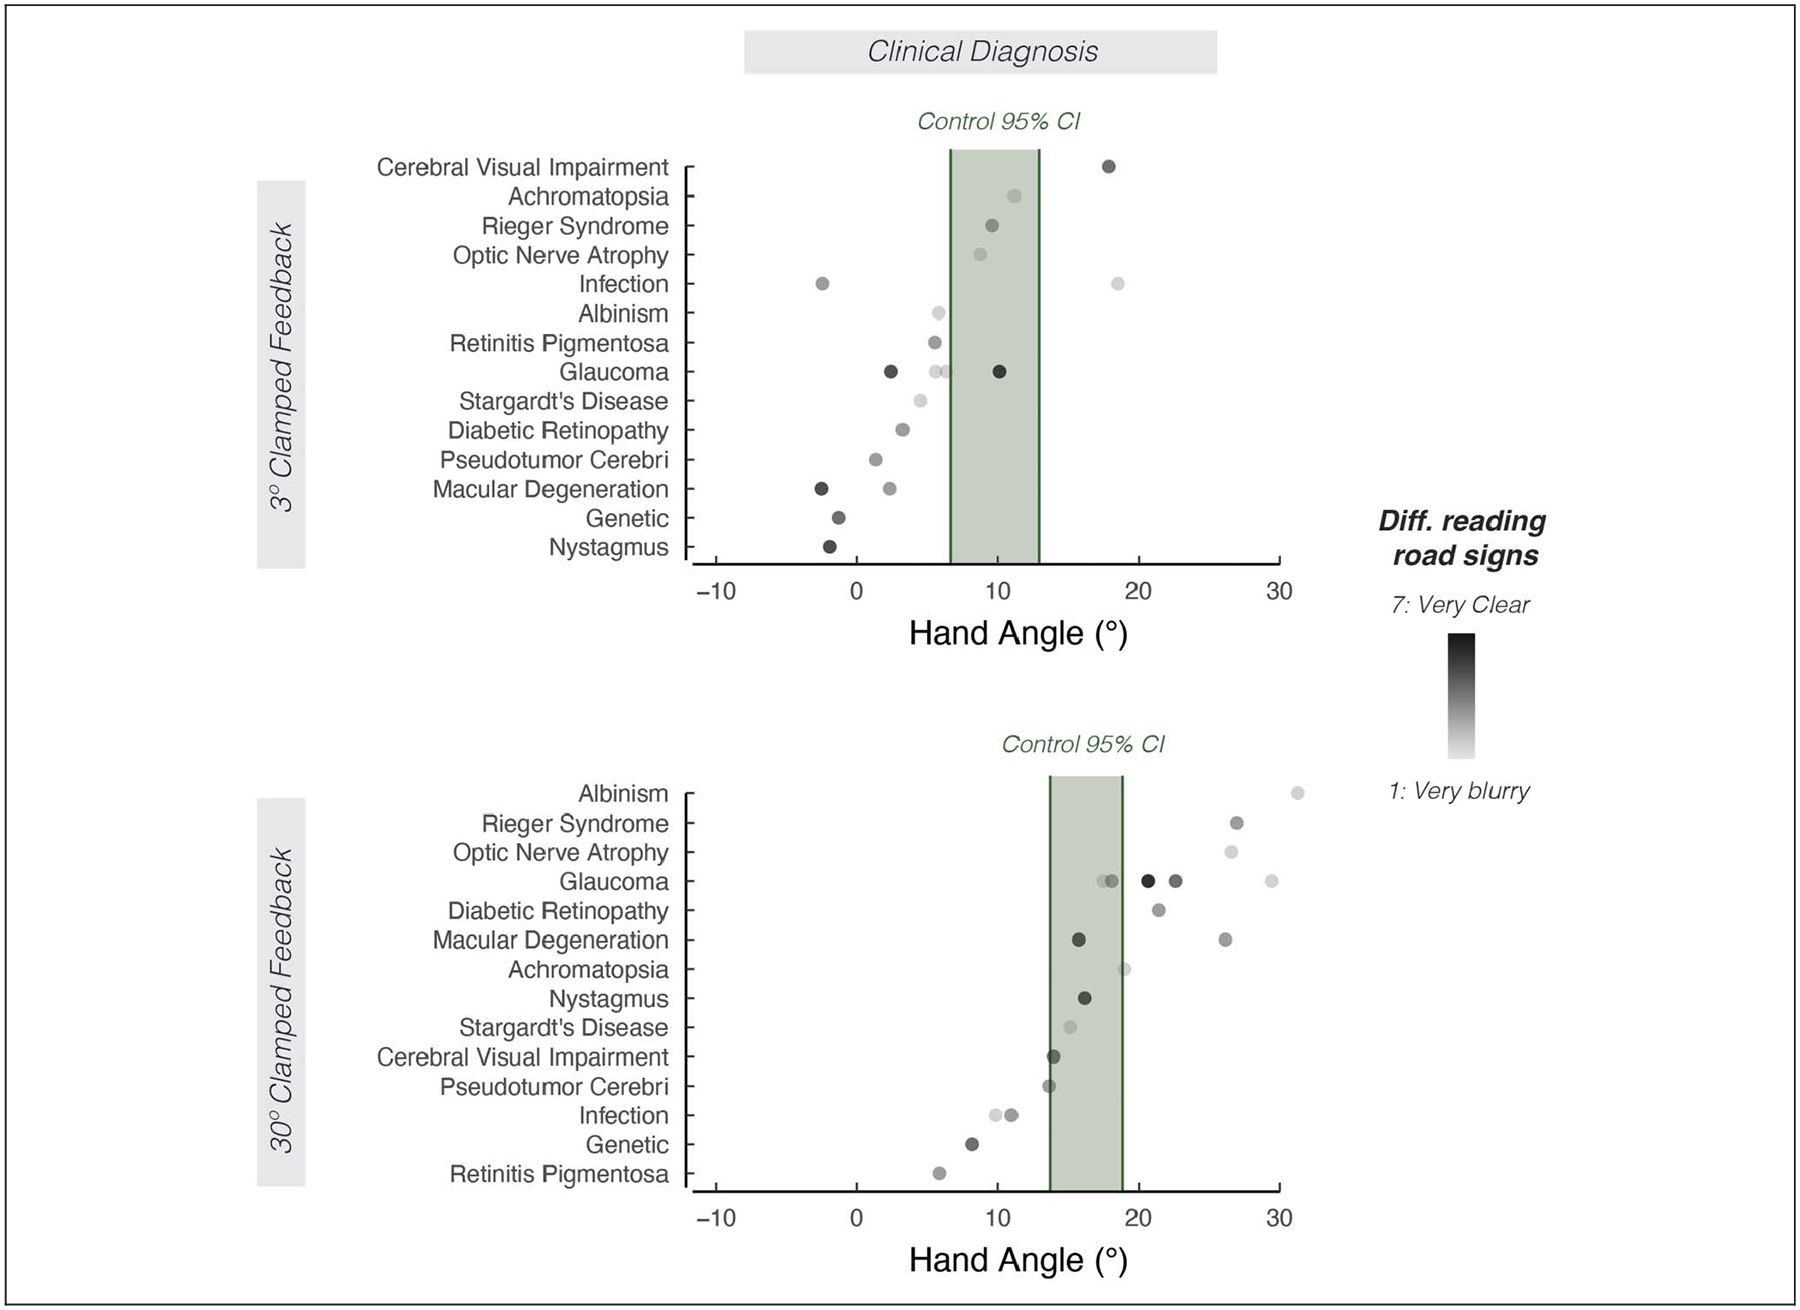
The effect of clinical diagnosis on motor aftereffects. Mean aftereffects sorted by clinical diagnoses involving low vision. Shading of the dot indicates how well participants report seeing road signs (light shading = road signs are very blurry; dark shading = road signs are very clear). The 95% confidence interval for the control group is indicated by the green shaded region.