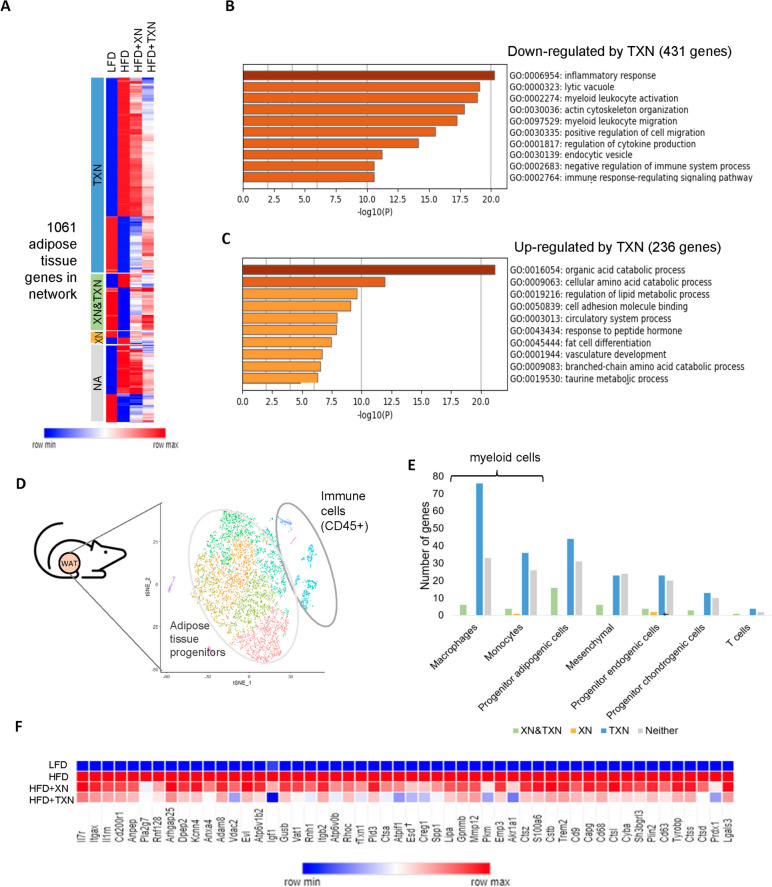
Fig. 2.
Inflammatory processes in adipose tissue are the primary processes affected by TXN. A Heatmap representing expression of each gene in the adipose tissue subnetwork across all treatment groups. Colors represent the quantile normalized log2(CPM+1) mean of each group, relative to the other groups in the row (e.g., the darkest blue color indicates the lowest mean while dark red indicates the highest). B Metascape functional enrichment of genes downregulated by TXN showing enrichment for inflammatory processes. C Genes up regulated by TXN are enriched for metabolic pathways. D The t-SNE plot shows adipose tissue from high fat high sugar diet fed mice (n = 5 mice, with 9383 pooled number of cells after preprocessing for quality [Additional file 1]). E The number of genes belonging to each cell-type assignment in the adipose tissue subnetwork. TXN improves gene expression primarily in the myeloid cell population. F Adipose tissue network genes improved by TXN treatment in the IR-ATM gene signature are shown. Dagger symbol indicates not significant change. Colors represent values calculated in the same way as in A

