Fig. 3.
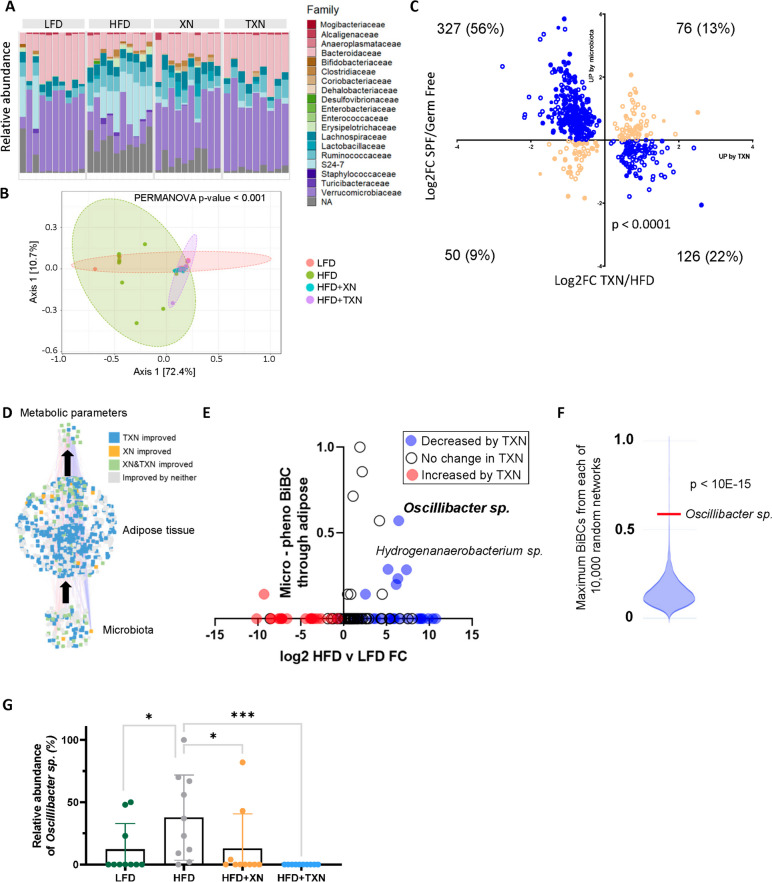
Identification of regulatory microbes causing the inflammatory response. A Family level relative abundance plots of microbes across the different treatment groups. B PCoA plot of microbiota based on treatment group. C The microbiota-dependent up- and down-regulated genes present in adipose tissue and improved by TXN treatment. The x-axis represents log2 fold change TXN/HFD and y-axis represents log2 fold change SPF/germ-free mice. Blue circles indicate genes whose expression was improved by TXN treatment and microbiota-dependent. Orange circles indicate no reversal in expression direction. The filled circles were assigned to myeloid cells (two-sided Fisher’s exact test, p-value < 0.0001). D The subnetwork derived from the original network to identify regulatory microbes that affect the host phenotypes by acting through adipose tissue. E BiBC between microbes and phenotypes indicates Oscillibacter sp. and Hydrogenanaerobacterium sp. as two regulatory microbes whose levels are both reduced by TXN treatment. F An analysis of 10,000 random networks with the same number of nodes and edges as the observed network revealed that the observed BiBC for Oscillibacter sp. was much higher than due to chance (p-value < 10E-15, one-sample Wilcoxon test). G The abundance of ASV_61 (identified as Oscillibacter sp.) in each treatment group. Brackets indicate the results for specific comparisons. Values are in normalized counts per million. Two-tailed Mann–Whitney p-values are shown; *p-value ≤ 0.05; ****p-value ≤ 0.0001

