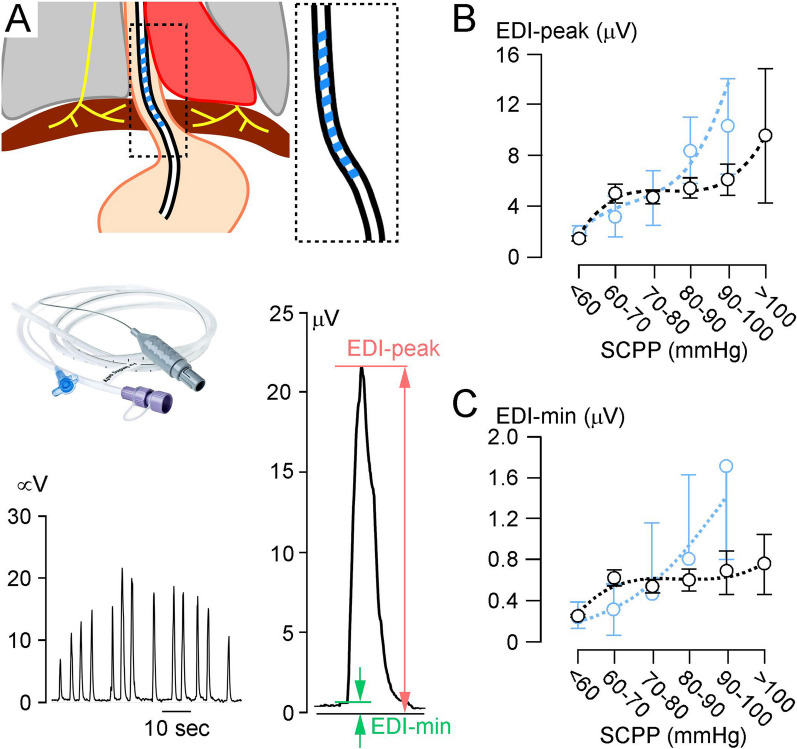
Fig. 2.
Electrical activity of the diaphragm (EDI). A (top left) Schematic for EDI monitoring. (top right) Magnified view of EDI nasogastric tube with electrode contacts (blue). (middle) Phot of an EDI nasogastric tube. (bottom left) EDI recordings from a C8 A TSCI patient. (bottom right) Magnified view of EDI signal showing EDI-min and EDI-peak. Diaphragm EMG versus SCPP for B EDI-peak, and C EDI-min. Black, all recordings; blue, recordings when not attached to ventilator. Mean ± standard error. Best-fit polynomial curves (B black, cubic: r2 = 0.90, B blue cubic: r2 = 0.98; C black, cubic: r2 = 0.98; C blue, quadratic: r2 = 0.95). Sample sizes in Additional file 8

