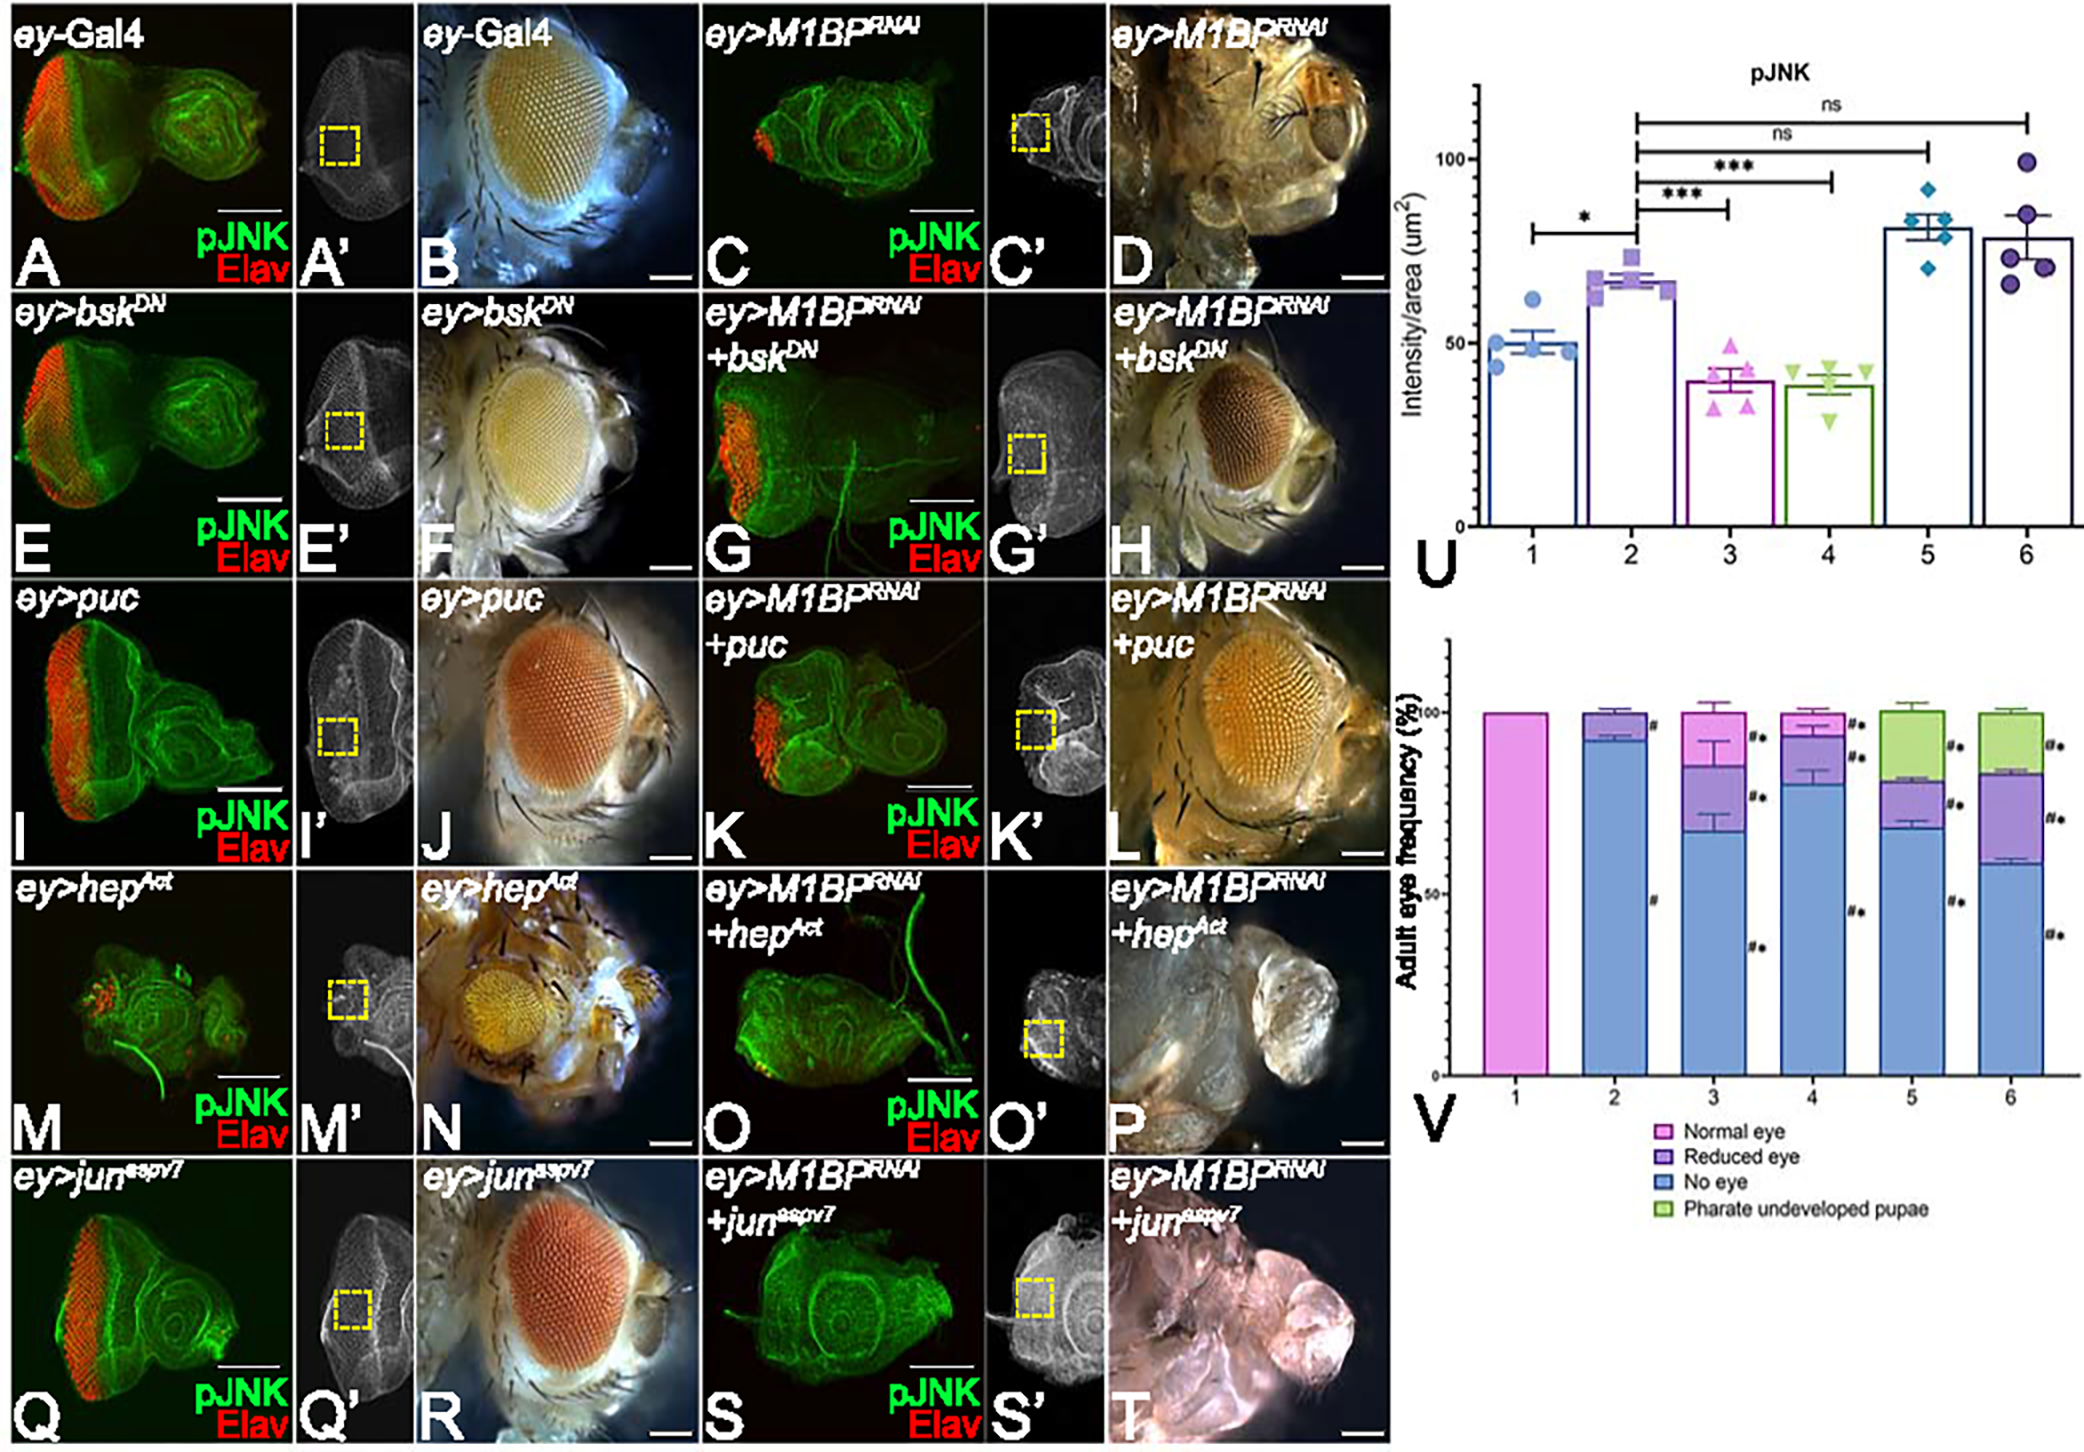
Figure 3: Modulation of JNK signaling affects eye suppression phenotype of M1BP downregulation.

(A, C, E, G, I, K, M, O, Q, S) Eye antennal imaginal disc of third instar larvae stained for pJNK (green) and pan-neuronal marker Elav (red). (A, A’) ey-Gal4 control discs showing pJNK expression. (A’, C’, E’, G’, I’, K’, M’, O’, Q’, S’) Eye antennal imaginal disc showing split channel for pJNK staining. Quantification was performed using standard 100X100 pixel ROI. ROI is shown as yellow dashed boxes. Adult eye images of control (B) ey-Gal4, downregulation of M1BP (D) ey>M1BPRNAi, downregulating JNK pathway: (F) ey>bskDN, (H) ey>M1BPRNAi+bskDN, (J) ey>puc, (L) ey>M1BPRNAi+puc, upregulating JNK pathway: (N) ey>hepAct, (P) ey>M1BPRNAi+hepAct, (R) ey>junaspv7, (T) ey>M1BPRNAi+junaspv7. Eye-antennal imaginal discs of control (A, A’) ey-Gal4, downregulation of M1BP (C, C’) ey>M1BPRNAi, downregulating JNK pathway: (E, E’) ey>bskDN, (G. G’) ey>M1BPRNAi+bskDN, (I, I’) ey>puc, (K, K’) ey>M1BPRNAi+puc, upregulating JNK pathway: (M, M’) ey>hepAct, (O, O’) ey>M1BPRNAi+hepAct, (Q, Q’) ey>junaspv7, (S, S’) ey>M1BPRNAi+junaspv7. Note that (H, L) downregulation of JNK signaling showed significant rescues in adult eye phenotypes; whereas (P, T) activation of JNK signaling enhanced the eye suppression phenotype of (D) ey>M1BPRNAi. (U) Quantification of pJNK intensity using Fiji/ImageJ software (NIH). The genotypes depicted in the graph are 1: ey-Gal4, 2: ey>M1BPRNAi, 3: ey>M1BPRNAi+bskDN, 4: ey>M1BPRNAi+puc, 5: ey>M1BPRNAi+hepAct and 6: ey>M1BPRNAi+junaspv7. (V) Graphical representation of adult eye phenotype frequency. The genotypes depicted in the graph are 1: ey-Gal4, 2: ey>M1BPRNAi, 3: ey>M1BPRNAi+bskDN, 4: ey>M1BPRNAi+puc, 5: ey>M1BPRNAi+hepAct and 6: ey>M1BPRNAi+junaspv7. For adult eye frequency, statistical significance with eyGal4 and ey>M1BPRNAi are depicted using # and * respectively. Graphs were plotted with mean +/− SEM. For quantification, statistical significance in each graph is shown by p-value: ****p<0.0001, ***p<0.001; **p<0.01; *p<0.05. The orientation of all imaginal discs is identical with posterior to the left and dorsal up. The magnification of all eye-antennal imaginal discs is 20X and adult eyes are 10X unless specified.
