
Figure 6: Downregulation of M1BP triggers autophagy.
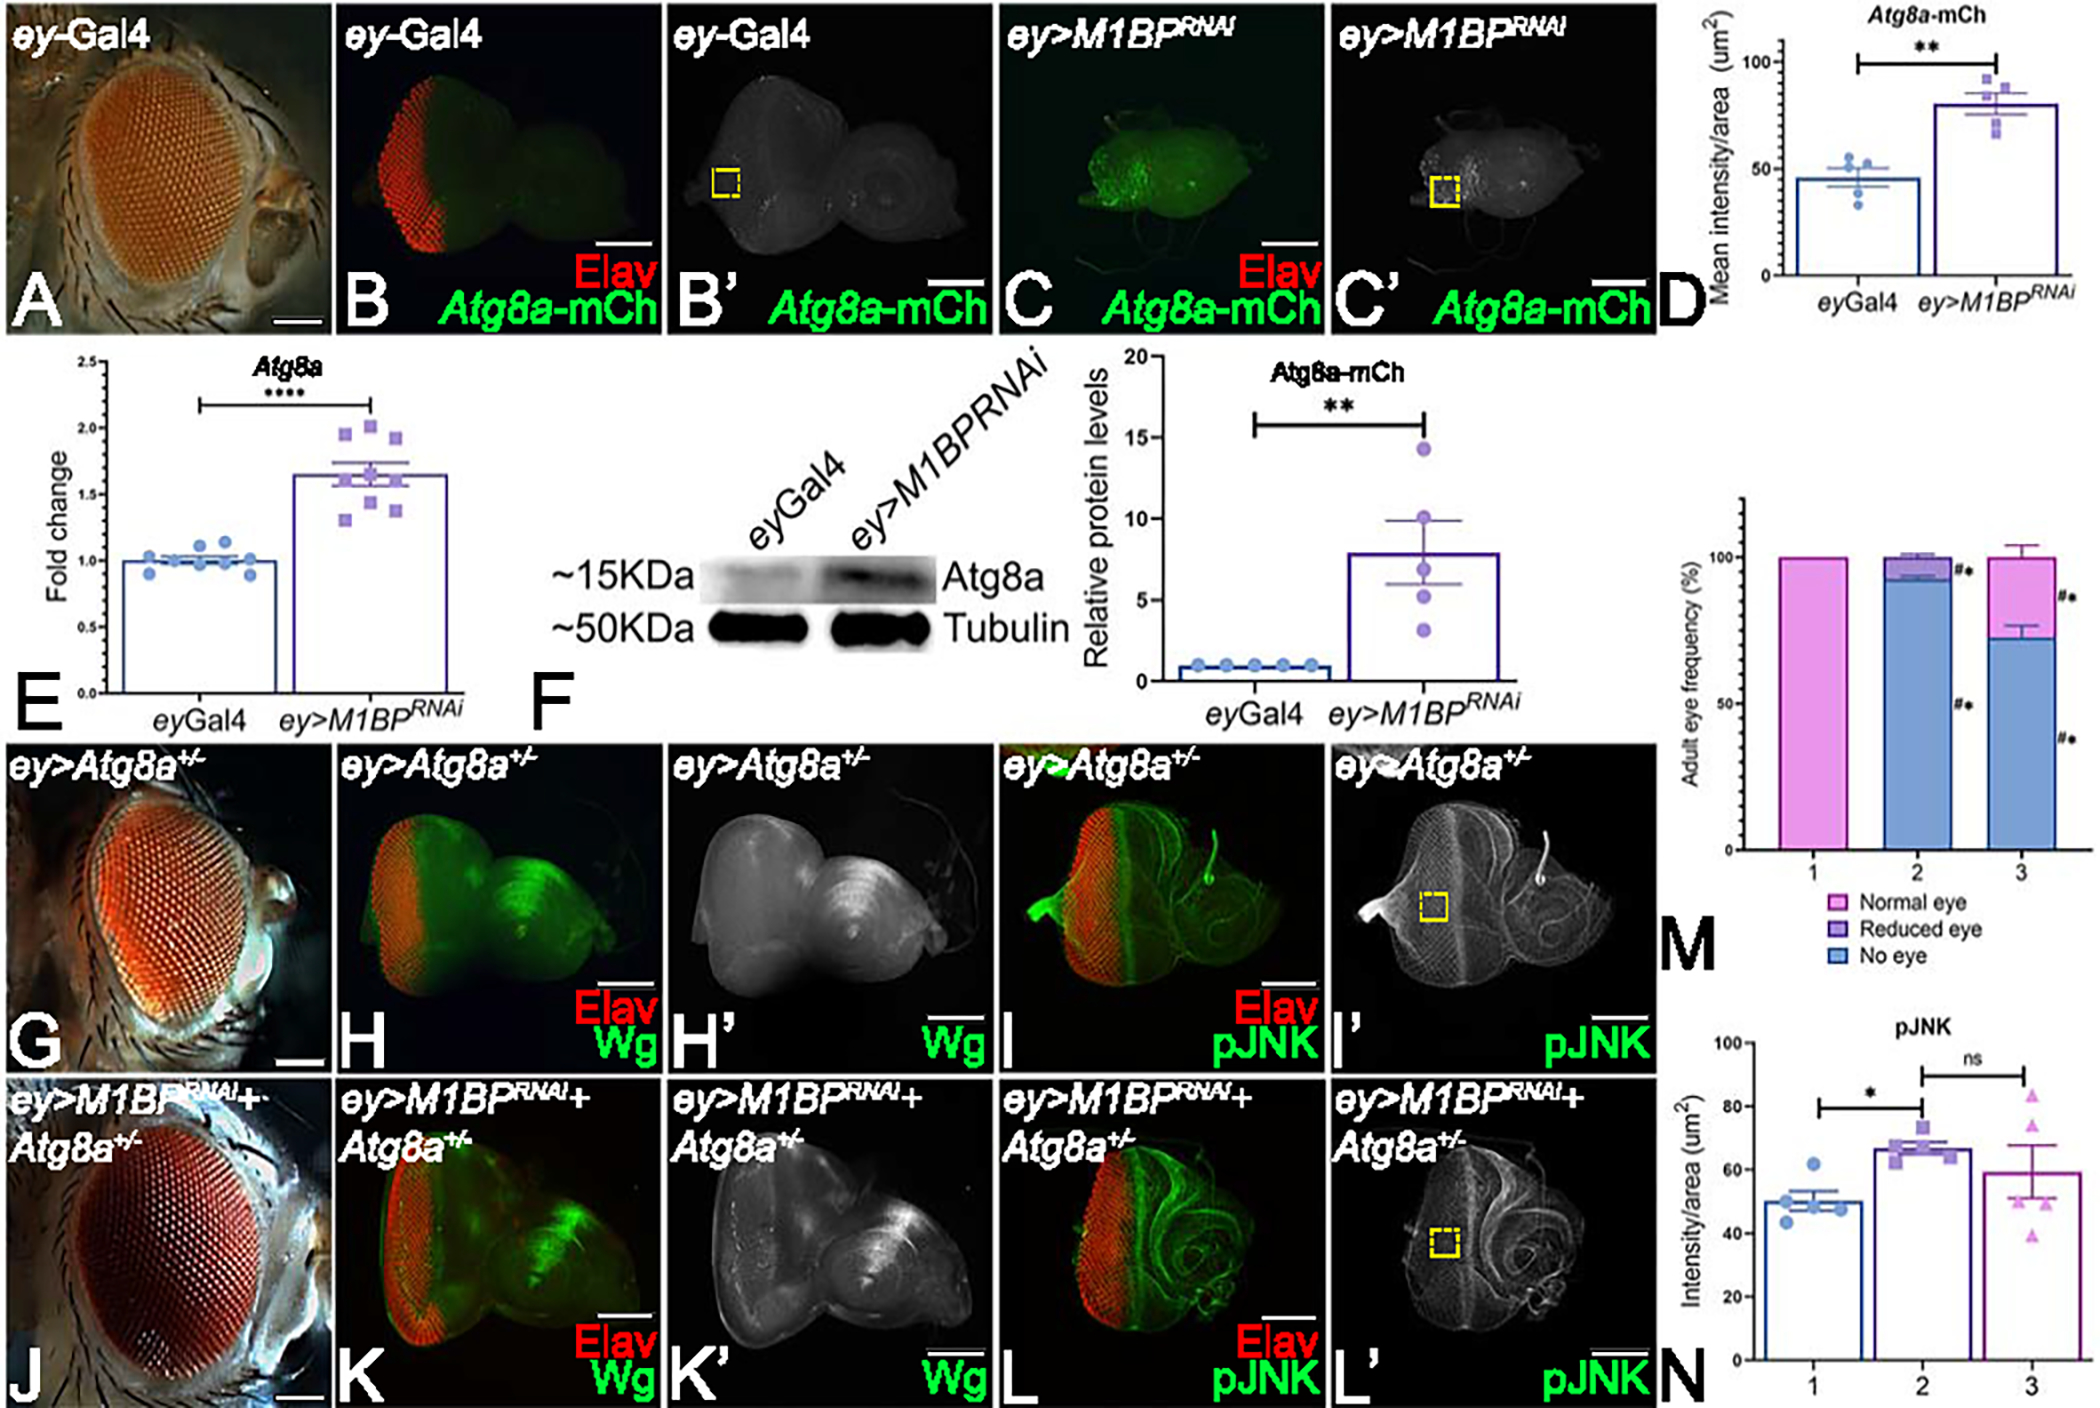
(A) ey-Gal4 adult eye. (B, B’, C, C’) Eye-antennal imaginal discs stained with pan neuronal marker Elav (red) and assessed for changes in expression of Atg8a-mCherry (green) reporter. (B’, C’) Eye antennal imaginal disc showing split channel for Atg8a-mCherry expression. (B, B’) ey-Gal4 control discs. (C, C’) Downregulation of M1BP in the entire developing eye (ey>M1BPRNAi). (D) Quantification of Atg8a-mCherry intensity conducted using Fiji/ImageJ software (NIH) using standard 100X100 pixel ROI. ROI is shown as yellow dashed boxes. (E) Relative expression of Atg8a at the transcriptional level using quantitative real time PCR (qRT-PCR) in ey>M1BPRNAi and ey-Gal4 control eye-antennal imaginal discs. (F) Levels of Atg8a in a semi-quantitative Western Blot shows higher levels of autophagy activation in ey>M1BPRNAi compared to ey-Gal4 control. The tubulin bands serve as internal loading control for normalization. The quantification of Atg8a band intensity reveals a significantly higher level in ey>M1BPRNAi when compared to ey-Gal4. (G, H, H’, I, I’) Blocking autophagy in the entire eye using Atg8a mutant (ey>Atg8a+/−) results in a near wild-type eye. Blocking autophagy using Atg8a mutant in ey>M1BPRNAi background (H, I, I’, J, J’) ey>M1BPRNAi+Atg8a+/− can rescue the eye suppression phenotype. Eye antennal imaginal discs of indicated genotypes stained for (H, K) Wg (green), (I, L) pJNK (green) and pan-neuronal marker Elav (red). Eye-antennal imaginal discs showing split channel for (H’, K’) Wg and (I’, L’) pJNK staining. (M) Graphical representation of adult eye phenotype frequency. The genotypes depicted in the graph are 1: ey-Gal4, 2: ey>M1BPRNAi, 3: ey>M1BPRNAi+Atg8a+/−. Statistical significance with eyGal4 and ey>M1BPRNAi are depicted using # and * respectively. (N) pJNK intensity quantification using Fiji/ImageJ software (NIH). The genotypes depicted in the graph are 1: ey-Gal4, 2: ey>M1BPRNAi, 3: ey>M1BPRNAi+Atg8a+/−. Quantification was performed using standard 100X100pixels ROI. ROI is shown as yellow dashed boxes. Graphs were plotted with mean +/− SEM. Statistical significance in each graph is shown by p-value: ****p<0.0001, ***p<0.001; **p<0.01; *p<0.05. The orientation of all imaginal discs is identical with posterior to the left and dorsal up. The magnification of all eye-antennal imaginal discs is 20X and adult eyes are 10X unless specified.