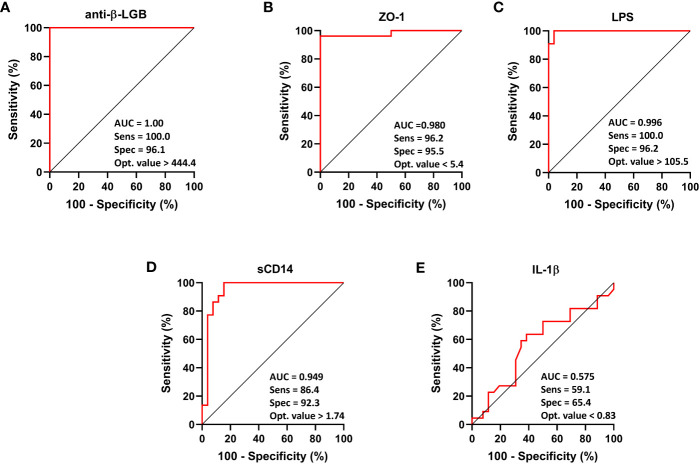
Figure 3.
ROC curve analysis of each intestinal barrier function biomarker to discriminate FM patients from healthy controls. IgG anti-β-LGB antibodies (A), ZO-1 (B), LPS (C), sCD14 (D), and IL-1β (E). ROC curves were used to explore the accuracy of each biomarker to discriminate between FM subjects and healthy controls. Cut-off values are shown for each biomarker with their respective sensitivity, specificity and optimal value. AUC values close to 1 indicate that a high true positive rate was achieved with false positive rate (ideal performance), while AUC values close to 0.5 indicate random performance. Anti-β-LGB, anti-beta-lactoglobulin antibodies; ZO-1, zonulin-1; LPS, lipopolysaccharides; sCD14, soluble CD14; IL-1β, interleukin-1-beta.

