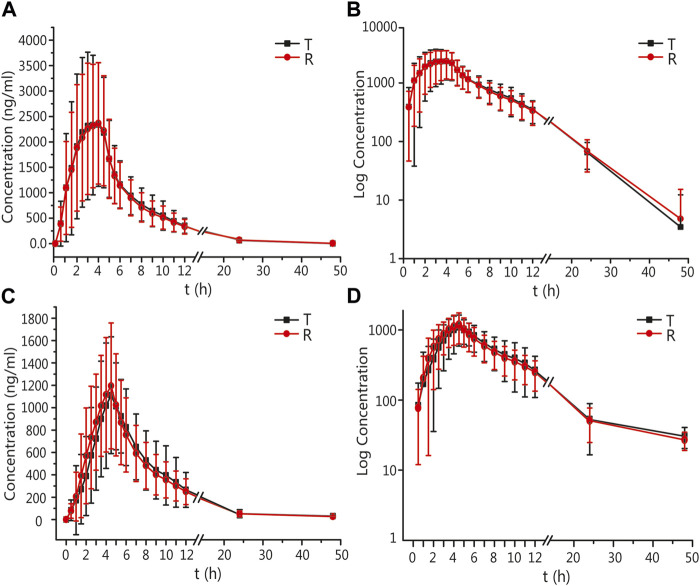
FIGURE 3.
PK analysis of valsartan of T and R formulations. Mean blood concentration (±SD) time curve after oral T and R formulations during fasting: arithmetic mean (A) and log transformation (B). Mean blood concentration (±SD) time curve after oral T and R formulations postprandially: arithmetic mean (C) and log transformation (D).

