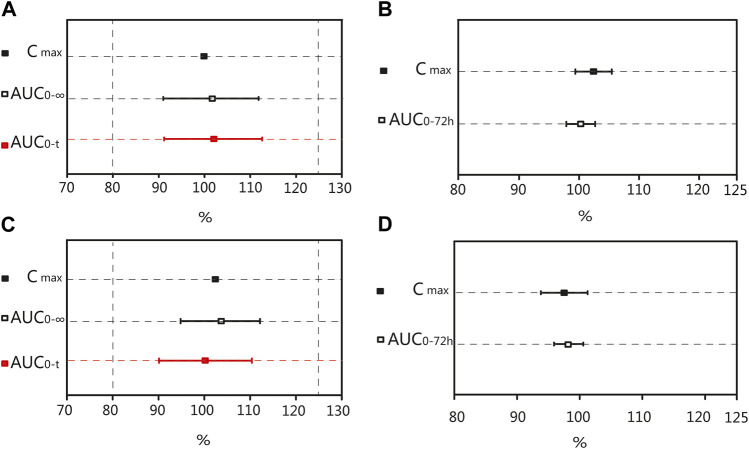
FIGURE 4.
Bioequivalence analysis of T and R formulations. The bioequivalence analysis of valsartan of T and R formulations during fasting (A) shows the ratio range of AUC0-t and AUC0–∞ of T and R formulations with 90% CIs and the Point Estimate of Cmax. The bioequivalence analysis of amlodipine of T and R formulations during fasting (B) shows the ratio range of the main PK parameters of amlodipine of T and R formulations with 90% CIs. The bioequivalence analysis of valsartan of T and R formulations during postprandial (C) shows the ratio range of AUC0-t and AUC0–∞ of T and R formulations with 90% CIs and the Point Estimate of Cmax. The bioequivalence analysis of amlodipine of T and R formulations during postprandial (D) shows the ratio range of the main PK parameters of amlodipine of T and R formulations with 90% CIs. (bioequivalence was declared if the Point Estimate and 90% CIs were within the prespecified acceptable ranges of 80%–125%). Cmax: the maximum observed drug concentration in the plasma; AUC0–∞: AUC of the analyte in the plasma over the time interval from time zero to infinity; AUC0-t: AUC of the analyte in the plasma over the time interval from time zero to the last measurable concentration.

