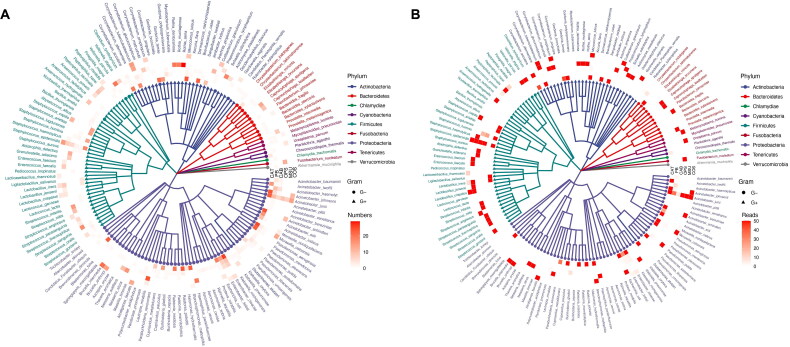
Figure 2.
Phylogenetic composition of the microbiota across six different sampling sites. The phylogenetic tree reveals the dominant species of each sample type (relative abundance > 10%). Gram-negative bacteria are represented by circular lines, while gram-positive bacteria are represented by triangular lines. The circles from the innermost to the outer represent samples represent the catheter tip, peripheral blood, catheter blood, oropharyngeal swab, midstream urine, and catheter outlet skin swab, respectively. The colored squares indicate the detection frequency (A) and reads (B) of dominant bacterial species in each sample type.

