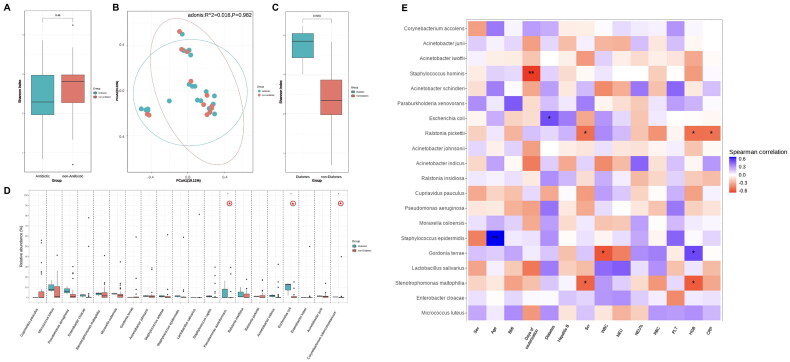
Figure 3.
Microbiota composition in correlation to clinical characteristics. Alpha diversity (A) and beta diversity (B) analysis results between the immunosuppressant/antibiotic-treated group and non-immunosuppressant/antibiotic-treated group. Alpha diversity (C) and analysis of species difference (D) between the diabetes mellitus group and non-diabetes mellitus group. (E) Heat map representing the correlation between catheter tip microbiota and clinical characteristics. The top 20 bacterial species with the highest relative abundance were displayed on the vertical axis, and correlation analysis was conducted with clinical indicators on the horizontal axis. The gradient and similarity of colors reflect the differences and similarities in the composition of multiple samples at various classification levels. *p <0.050, **p <0.010.

