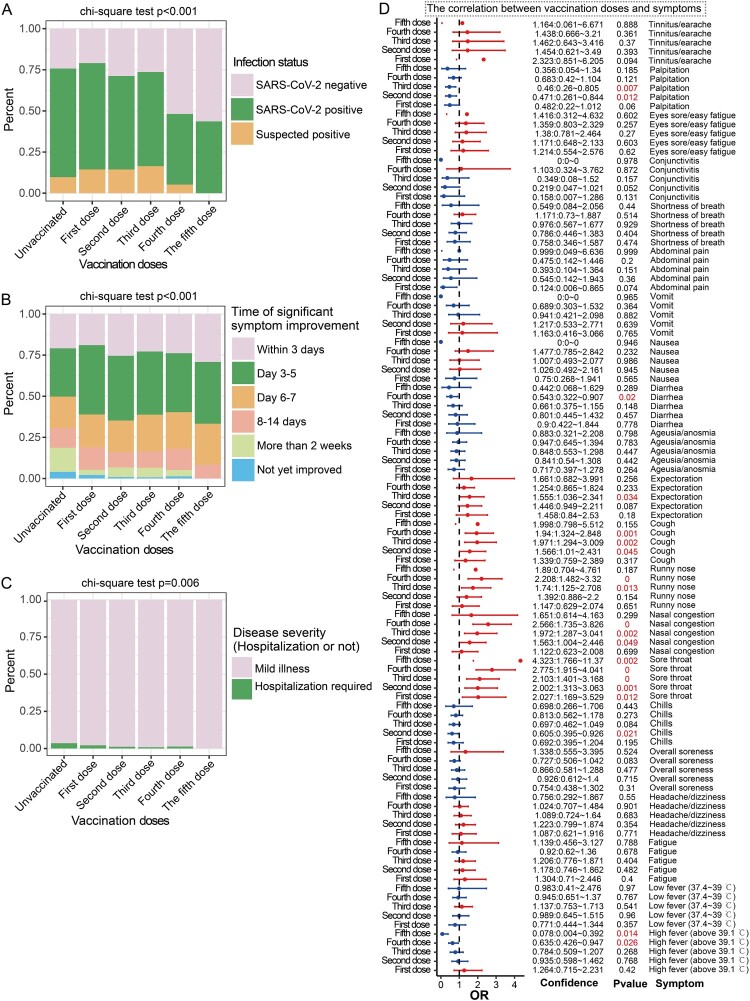
Figure 2.
Breakthrough infections in participants with different vaccine doses. A: Stacked bar chart showing the proportion of SARS-CoV-2–positive participants in the unvaccinated group and different vaccine dose groups. B: Stacked bar chart showing the proportion of participants demonstrating significant symptom improvement within one week in the unvaccinated group and the different vaccine dose groups. C: Stacked bar chart showing the proportion of hospitalized participants in the unvaccinated group and the different vaccine dose groups. D: Forest plot showing the effects of different vaccine doses on symptom frequencies. Unvaccinated participants were used as control variables. OR > 1 represents an increased risk of symptoms, OR < 1 represents a reduced risk of symptoms, which is a potential protective factor and OR = 1 represents no correlation with symptoms.

