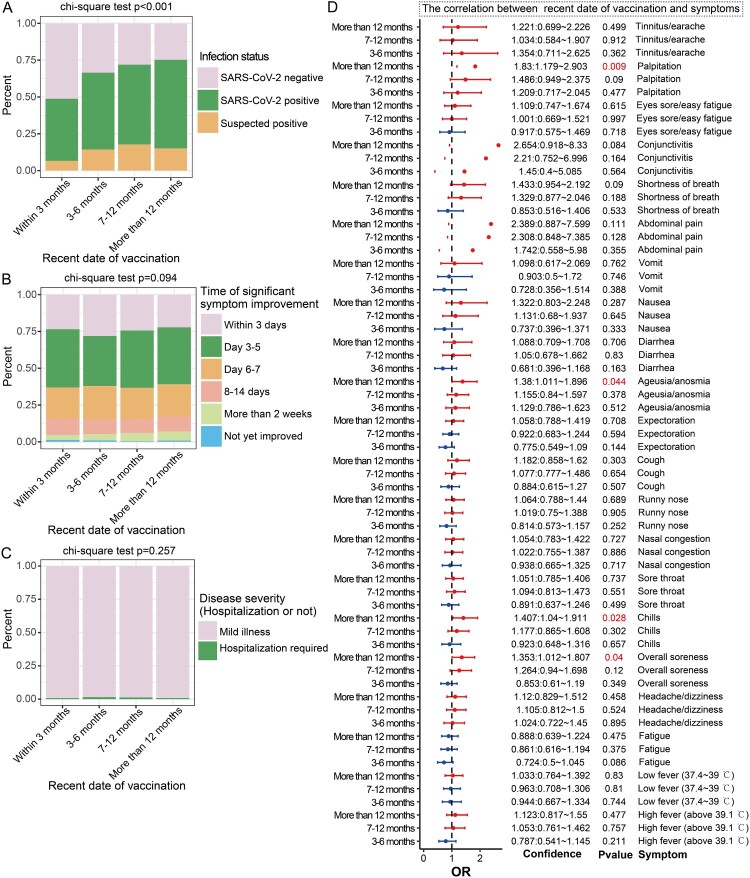
Figure 3.
Vaccination timing is associated with breakthrough infection. A: Stacked bar chart showing the proportion of SARS-CoV-2–positive cases among the different vaccination timing groups. B: Stacked bar chart showing the timing of significant improvement of symptoms in the different vaccination timing groups. C: Stacked bar chart showing the proportion of hospitalization among the different vaccination timing groups. D: Forest plot showing the effect of vaccination timing on the prevalence of COVID-19 symptoms across different groups. The group of participants who received vaccinations within 3 months served as the control group in this analysis. OR > 1 represents an increased odds ratio of symptoms, OR < 1 represents a reduced risk of symptoms, which is a potential protective factor, and OR = 1 represents no correlation with symptoms.

