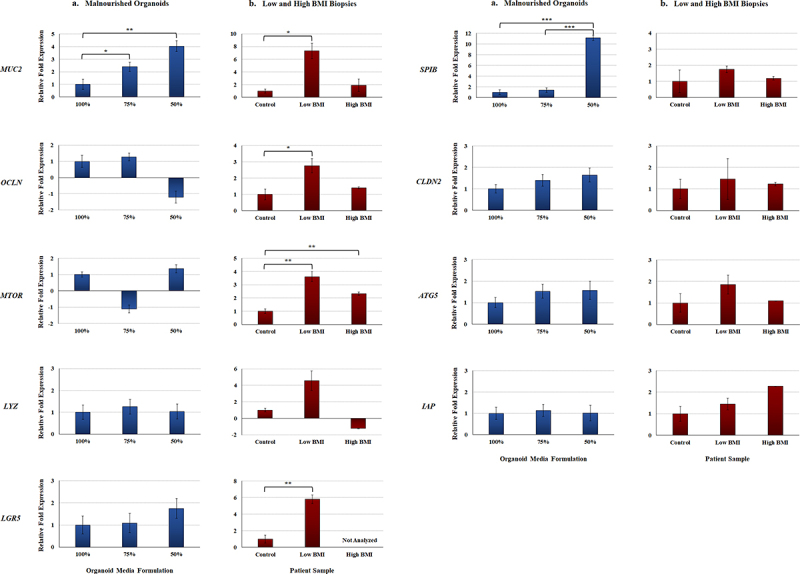
Figure 3.

Gene expression analyses of malnourished organoids and patient biopsy samples with different BMIs. Quantitative RT-PCR was performed for the indicated genes. Data bars represent the average fold change ± the SEM. All data were normalized to the expression of the 18S housekeeping gene for each experiment. Statistical significance was determined with the Student’s T-test of the ΔCT and the treatment comparisons that are statistically different are indicated for each gene and comparison. Data were considered significant at a p value of < .05 (*, <.05; **, <.01; ***, <.001). Please note the different y-axes for each graph.
a. Malnourished organoids. Data are expressed as the average fold change relative to the 100% media formulation. Data for each gene represent expression values from the D11, D14, and D15 organoid lines, each cultured in the 100%, 75%, and 50% media formulations. A total of three biologically independent experiments were performed, and each experiment had technical duplicates.
b. Biopsy samples from low and high BMI individuals. Data are expressed as the average fold change relative to the healthy control biopsy samples. Gene expression data for both the healthy control and low BMI samples were collected from three independent donors (biological replicates), while the high BMI samples was from one donor. Each experiment had technical duplicates.
