Figure 5.

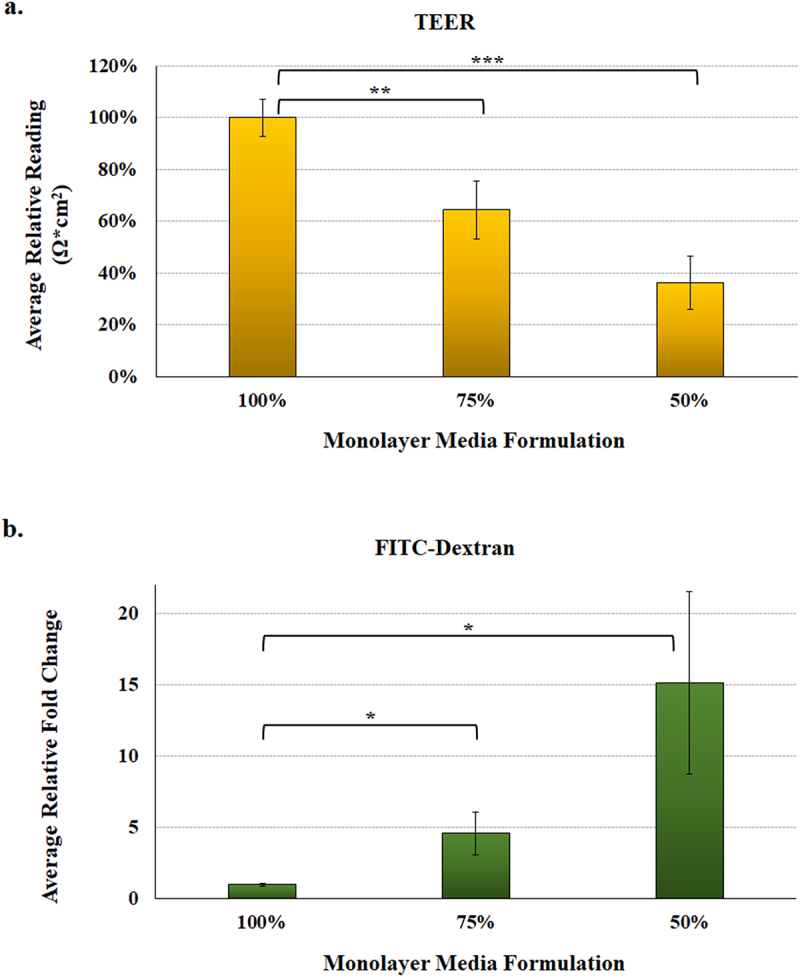
Malnourished monolayer permeability analysis. To measure integrity and permeability of the malnourished monolayers, mHIODEM were derived from the D11 and D14 organoid lines, and TEER and diffusion of FITC-dextran were measured. Each measurement occurred following monolayer differentiation with DAPT. Data represent three biologically independent experiments, each with at least two technical replicate wells. For both analyses, the average data ± SEM are plotted. Statistical significance was determined with the Student’s T-test comparing results from the 100% media to the 75% or 50% media. Data were considered significant at a p value of < .05 (*, <.05; **, <.01; ***, <.001). Please note the different y-axes for each graph.
a. Transepithelial electrical resistance (TEER) was evaluated as a measure of resistance multiplied by the area of the transwell (Ω*cm2). Data are plotted relative to the 100% media condition, which is set at 100%. There was a significant decrease in TEER for the 75% (**, p < .01) and 50% (***, p < .001) media formulations, indicating higher transcellular and paracellular permeability under malnourished conditions. There was also a decrease between the 75% and 50% media, but the p value was .07.
b. FITC-dextran passage was evaluated as a measure of paracellular permeability by examining diffusion of the 4 kilodalton FITC-dextran molecule. There was a significant increase in FITC-dextran passage in both the 75% and 50% media formulations (*, p < .05), indicating higher paracellular permeability of the malnourished monolayers. There was also an increase in the 50% media relative to the 75% media, but the difference was not significant.
