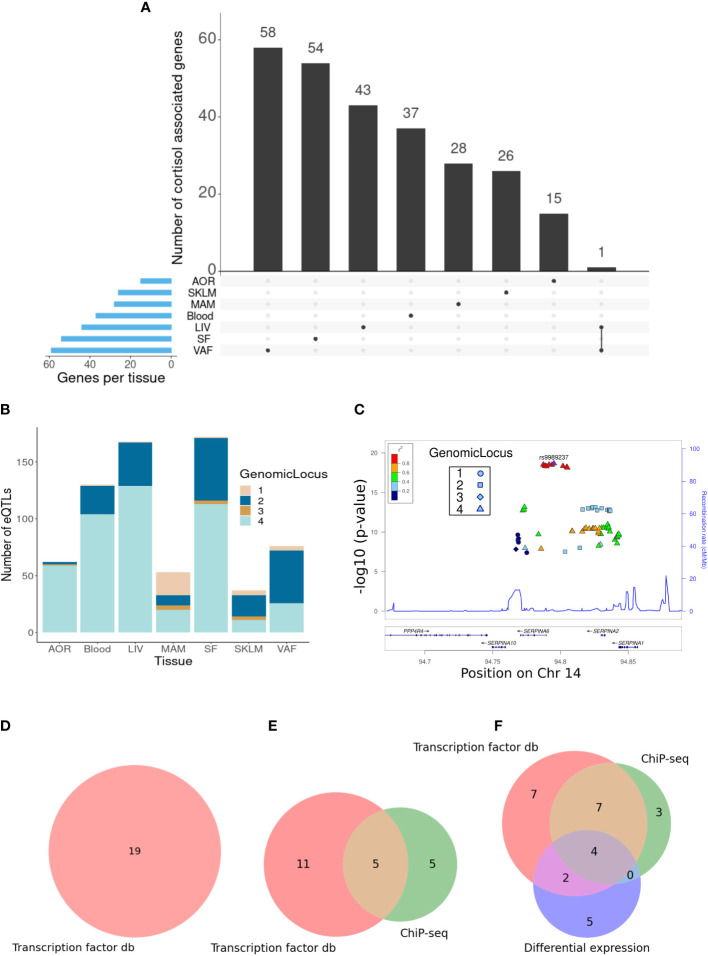
Figure 1.
Identification of cortisol-associated trans-genes across STARNET tissues (FDR = 15%). (A) Upset plot showing the distribution of trans-genes across STARNET tissues, including genes shared by multiple tissues. Tissues include the atherosclerotic aortic root (AOR), skeletal muscle (SKLM), internal mammary artery (MAM), blood (Blood), liver (LIV), subcutaneous fat (SF), and visceral abdominal fat (VAF). (B) Distribution of trans-eQTLs across tissues and colored by genomic locus (LD block) of associated SNP. (C) LocusZoom plot (30) showing the location of cortisol-associated SNPs within defined LD blocks. (D) Venn diagrams where groupings represent different sources used to identify GR-linked trans-genes in the liver, (E) visceral abdominal fat, and (F) subcutaneous fat. These sources include transcription factor databases (db), ChIP-seq from perturbation-based experiments (23), and differential expression of dexamethasone-treated mice (24).

