Figure 3.
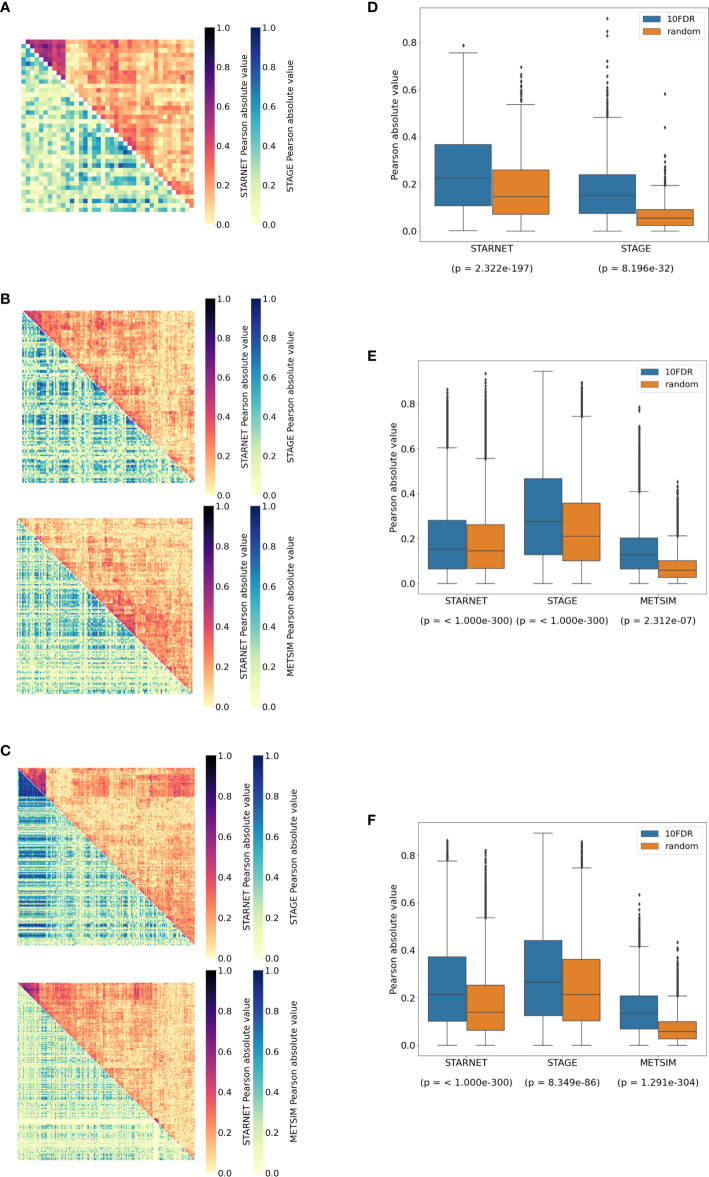
Replication of cortisol-associated gene networks in independent datasets. (A) Correlation heatmap showing pairwise Pearson correlations between CPEB2, (B) IRF2, and (C) RNF13 network targets. Hierarchical clustering of genes in STARNET (discovery) was applied to the same genes within replication datasets. (D) Correlations between network targets in discovery vs. replication datasets for CPEB2, (E) IRF2, and (F) RNF13 networks. The Kruskal–Wallis test calculated for the distribution of correlations between network targets compared to correlations within random gene sets of the same size.

