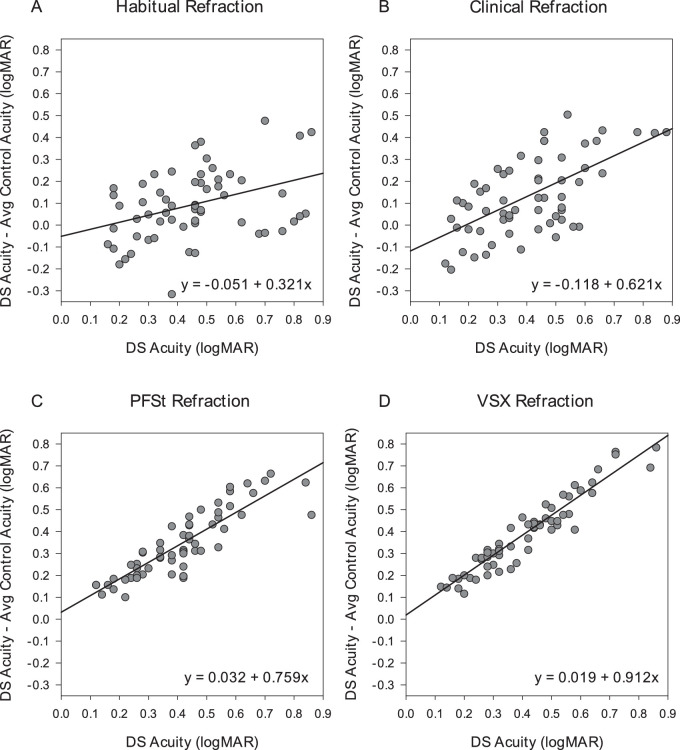
Figure 2.
Plots of agreement between visual acuity outcome of participants with DS and difference between control and DS visual acuity outcomes for habitual correction (A), clinical correction (B), PSFt correction (C), and VSX correction (D). The comparisons are shown as plots of difference versus mean with the best-fit regression line rather than lines delineating the 95% limits of agreement.

