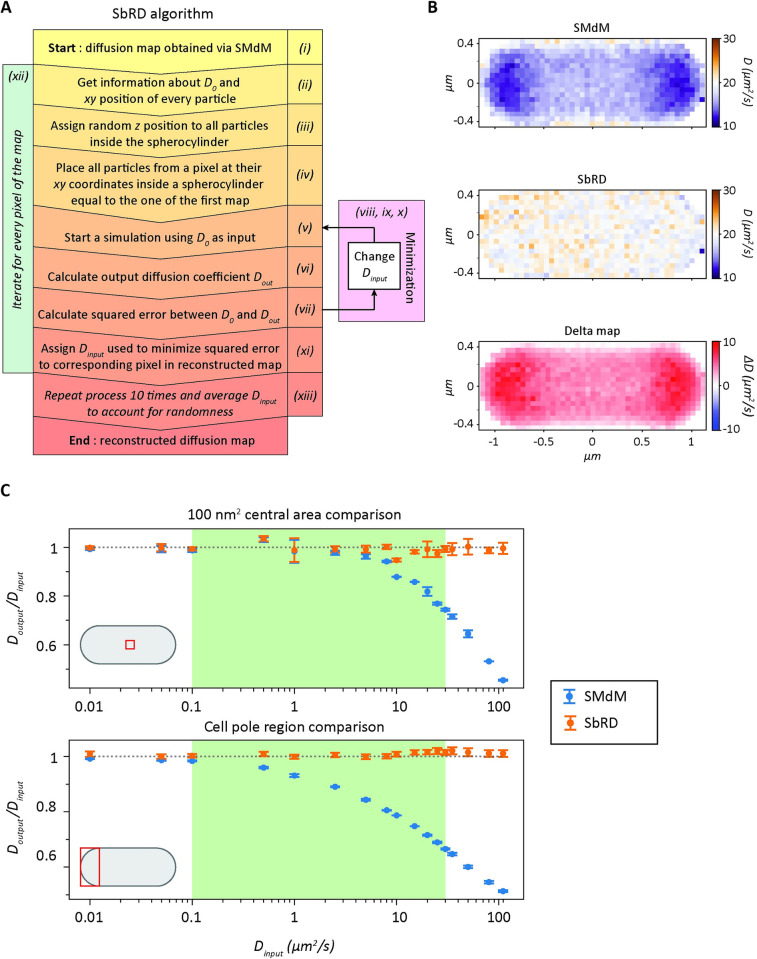
Fig 2. Simulation-based Reconstructed Diffusion.
(A) Algorithm representation of SbRD. (B) Diffusion maps of a spherocylinder obtained by analyzing a Smoldyn simulation created with an input diffusion coefficient of 20 μm2/s. Maps are obtained via SMdM analysis (top) and via SbRD (center). The difference between the SbRD map and the SMdM map is depicted in the bottom panel. (C) Comparison of the dependence of the ratio of Doutput / Dinput in a simulated spherocylinder when analyzing the centermos 100 nm2 area (top) and the cell pole (bottom) with SMdM and SbRD. The gray dotted line represents the ideal case in which the ratio of Doutput over Dinput is one. The relevant range of diffusion coefficients for proteins in the cytoplasm is highlighted in green.

