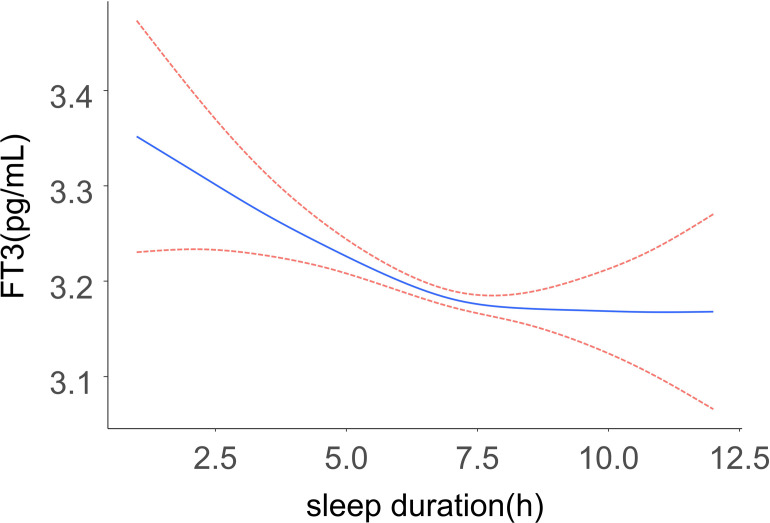
Fig 2. A flat L-shaped association between sleep duration and FT3 was found in the generalized additive model (GAM).
The solid line represents the smoothed curve fit between the variables and the dashed line represents the 95% confidence interval of the fit. The model was adjusted for sex, age, race/ethnicity, marital status, BMI, sleep disturbance, poverty income ratio, smoking status, alcohol consumption status, UIC.

