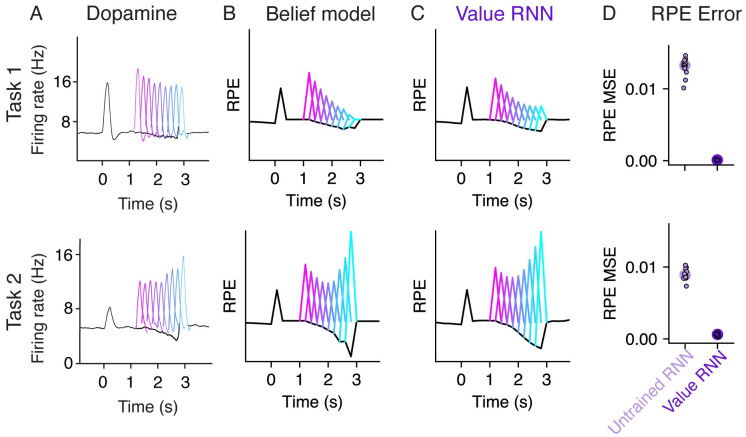
Fig 3. RPEs of the Value RNN resemble both mouse dopamine activity and the Belief model.
A. Average phasic dopamine activity in the ventral tegmental area (VTA) recorded from mice trained in each task separately. Black traces indicate trial-averaged RPEs relative to an odor observated at time 0, prior to reward; colored traces indicate the RPEs following each of nine possible reward times. RPEs exhibit opposite dependence on reward time across tasks. Reproduced from Starkweather et al. (2017) [7]. B-C. Average RPEs of the Belief model and an example Value RNN, respectively. Same conventions as panel A. D. Mean squared error (MSE) between the RPEs of the Value RNN and Belief model, before and after training each Value RNN. Small dots depict the MSE of each of N = 12 Task 1 RNNs and N = 12 Task 2 RNNs, and circles depict the median across RNNs.

