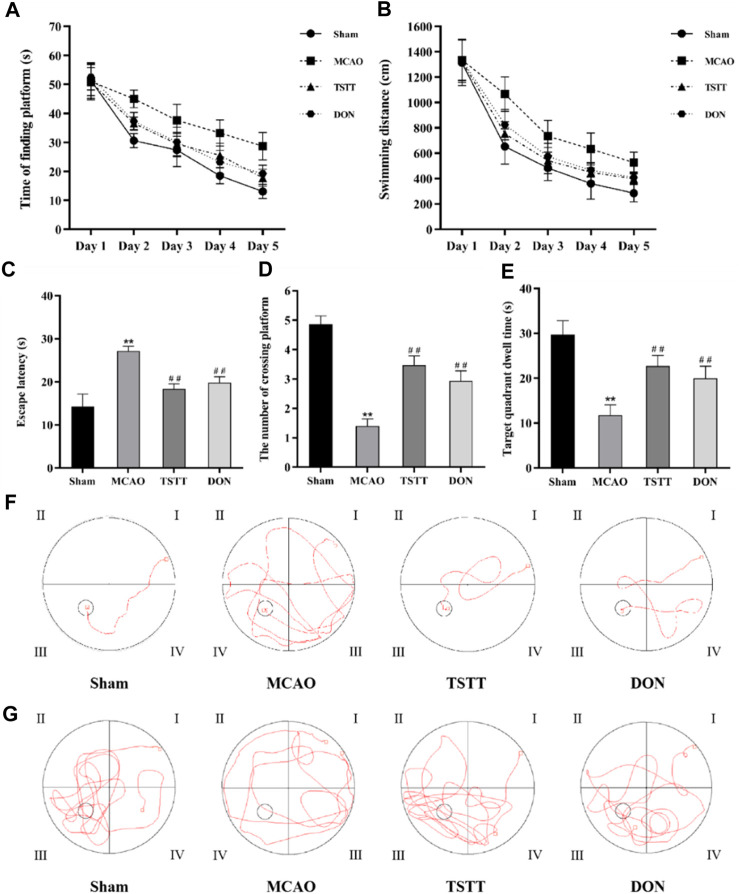
FIGURE 1.
Morris water maze test results and representative swimming trajectory of rats from each group: (A) time to find the platform, (B) swimming distance, (C) escape latency, (D) the number of crossing platforms, (E) target quadrant dwell time, (F) swimming trajectory map for positioning navigation experiments, and (G) swimming trajectory map for space exploration experiments. ** p < 0.01 vs. Sham group; ## p < 0.01 vs. MCAO group; n = 15.

